Best Android App Analytics Tools in 2026

Quick summary
Here are the top 8 Android analytics tools compared by key features, pricing, and supported platforms. Tools like UXCam stand out for combining user behavior tracking, engagement insights, and real-time analytics. Use this guide to choose the right tool for improving app performance.
What are android analytics tools?
Android analytics tools are platforms that help app developers and product teams track, analyze, and interpret user behavior within their mobile apps.
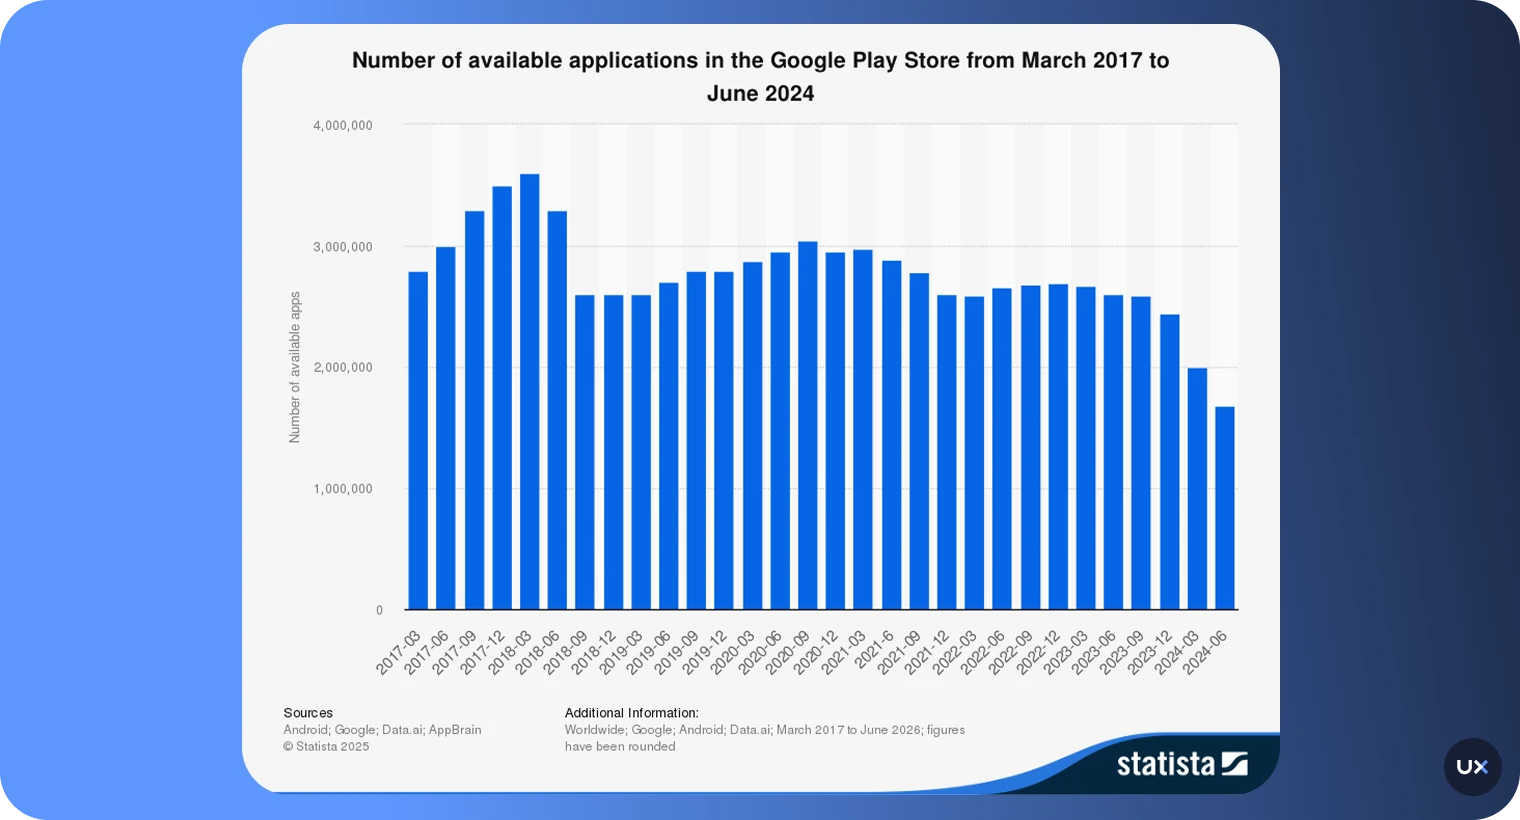
The Android app market is highly competitive. To position oneself well and gain a competitive edge, android app analytics solutions are essential.
They provide insights into the users’ behavior, uncover weaknesses, and allow you to deliver the best user experience.


These tools go beyond basic metrics like pageviews or downloads. They provide insights into user actions, such as button clicks, screen navigation, and session lengths, helping teams identify pain points and areas for improvement.
For example, global day 1 retention rate (number of users using an app one day after installation) is at 25%. In the Android ecosystem, average Day 1 retention sits at 21.1%.These benchmarks show that tracking user behavior immediately and continuously is critical, and analytics tools are the mechanism.
Best android analytics tools for mobile apps
Comparing different mobile app analytics tools and choosing the best for your Android app is a time-intensive task.
To help you with your decision, we’ve done extensive research and found the 8 Best Android Analytics Tools for mobile apps.
| Tool | Best for | Pricing | Platforms supported |
|---|---|---|---|
| UXCam | In-depth qualitative analytics with session replay, heatmaps, and user journey analysis to understand user behavior. | Free / Paid (custom pricing) | iOS, Android, Web |
| Google Firebase | Comprehensive analytics and infrastructure services, including crash reporting and real-time app optimization. | Free / Pay-as-you-go plan | iOS, Android |
| Amplitude | Automated reports and user behavior analysis to evaluate feature effectiveness and user engagement. | Free / Paid starts at $61/month | iOS, Android |
| Mixpanel | Funnel creation and monitoring to analyze user interactions and optimize conversion paths. | Free / Paid (starts at $0.28 per 1k events | iOS, Android, Web |
| Appsflyer | Teams in need of advanced attribution, multi-touch analytics, fraud protection, and deep linking | Free / Paid (a custom pay-as-you-go plan) | iOS, Android, Web |
| Countly | Open-source platform focusing on customer journey understanding with broad platform coverage. | Free / Paid starts at $40/month) | iOS, Android, Web |
| Adobe Analytics | Enterprise-level solution emphasizing customer and marketing analysis with customizable reporting. | Custom pricing for individual plans | iOS, Android |
| Localytics | Combines analytics with marketing tools, allowing targeted push notifications and user comparisons. | Custom pricing for plans | iOS, Android, Web |
1. UXCam


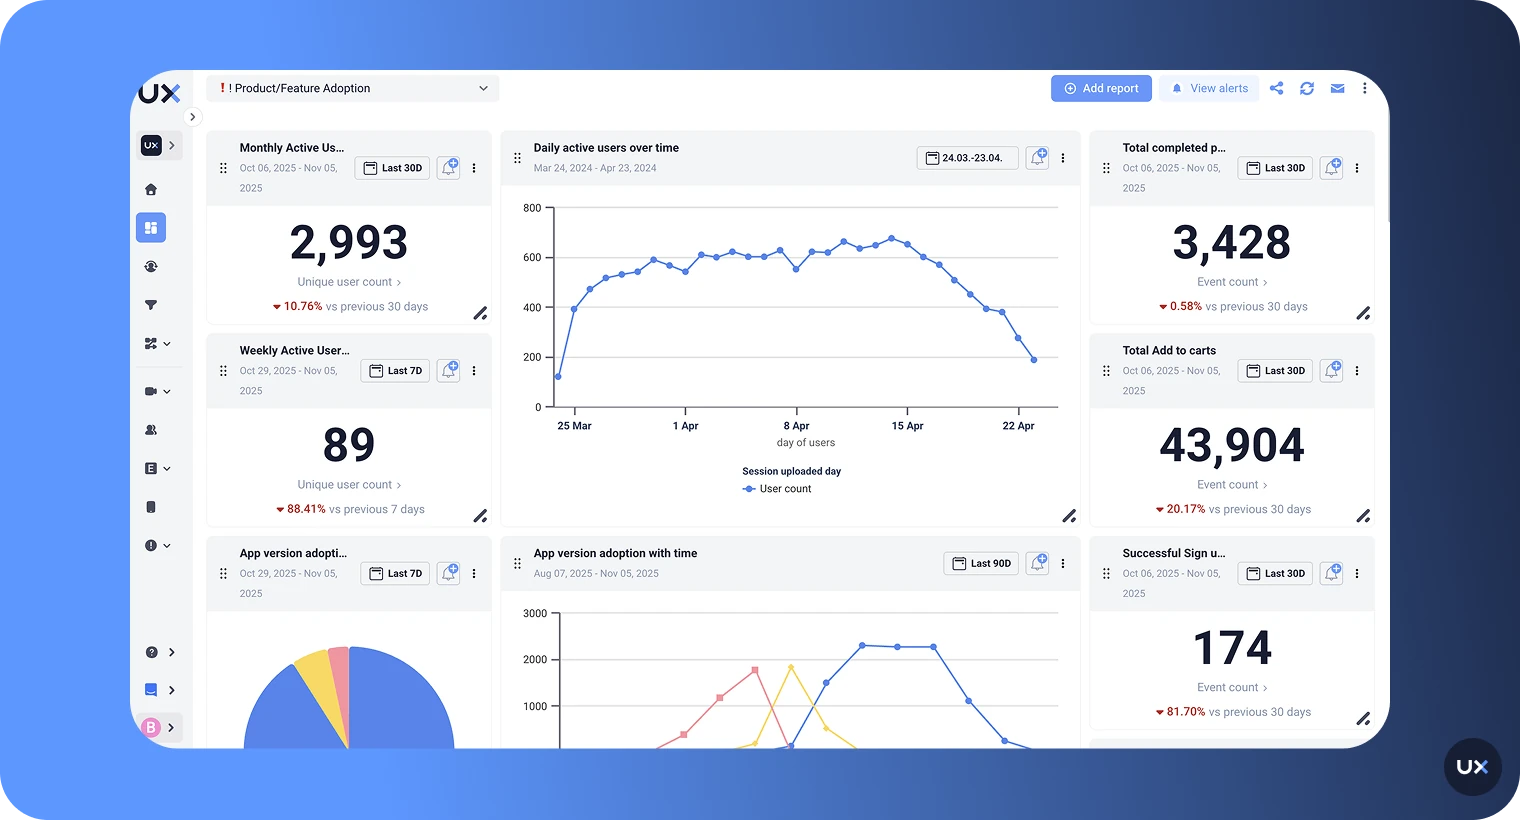
UXCam is a comprehensive product analytics platform for both mobile and web apps. It gives product, UX, and engineering teams a complete view of how users behave and why, combining data and visual context to reveal the full story behind every interaction.
Unlike traditional analytics tools that focus only on numbers, UXCam blends quantitative metrics with qualitative insights. Through session replays, heatmaps, and user journey analysis, teams can see how users experience their product in real time, spot friction points, and make confident decisions that improve retention and key KPIs.
UXCam helps you understand what users do, and why they do it, so you can deliver experiences that drive growth across both mobile and web platforms. It’s the best product analytics tool for teams that want complete behavioral visibility, not just metrics.
The #1 reason to use UXCam is simple: You don’t want to be blind.


Key features
Session replays & heatmaps: Visualize how users interact with your app.
Funnels & retention tracking: Identify where users drop off and which paths keep them engaged.
Frustration & issue detection: Detects rage taps, UI freezes, and crashes and links them to session data.
Smart segmentation: Group users by behavior, device, OS, or app version for deeper insight.
Cross-platform analytics: Unified dashboards for iOS, Android, React Native, Flutter, Xamarin, and Web.
Event autocapture: Records every interaction automatically, no manual tagging or configuration required.
Privacy-first design: Includes data masking, GDPR/CCPA compliance, and secure infrastructure.
Pros
Easy to set up with minimal event instrumentation
Combines qualitative and quantitative analytics in one platform.
Deep behavioral insights that go beyond surface-level metrics.
Minimal engineering effort thanks to automatic capture and lightweight SDK.
Crash and issue tracking helps engineering teams resolve bugs quickly.
Optimized for performance and privacy, appealing to enterprise teams.
Strong cross-platform coverage for mobile + web.
Cons
Some advanced analytics and enterprise features require higher-tier plans.
Pricing
UXCam offers a free plan that includes up to 3,000 sessions per month. Paid plans are customized by session volume and features. Contact us for a personalized quote.
2. Google Firebase Analytics


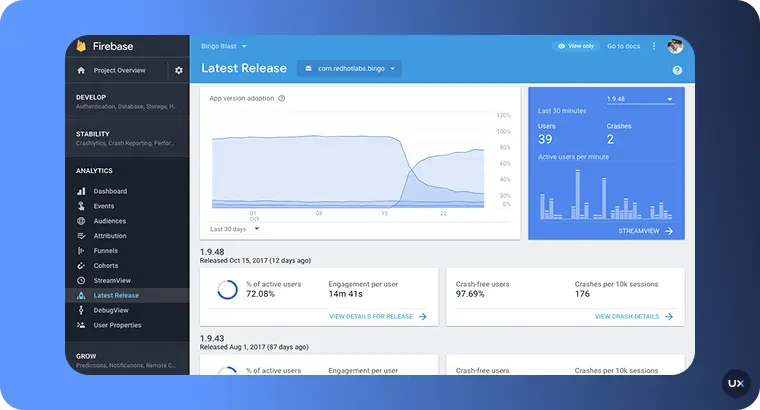
Firebase is a comprehensive app development platform from Google that combines powerful analytics with backend services. It provides real-time app optimization, crash reporting, and performance monitoring, making it a versatile solution for developers looking to improve their mobile apps' performance.
Key features:
Event tracking: Capture custom user actions like sign-ups and purchases.
Audience segmentation: Group users by behavior, device type, or demographics.
Real-time analytics: Monitor active users, sessions, and events as they happen.
Attribution tracking: Tie app installs and conversions back to ad campaigns and sources.
Deep integrations: Links to Crashlytics, Remote Config, BigQuery, and Google Ads for advanced analysis and optimization.
Pros
Integrated backend services
Optimized for real-time apps
Easy setup
Reliable crash reporting
Free tier for small projects
Cons
Marketing tools are basic
Free plan offers limited features
Lacks advanced analytics for deep insights
Pricing
Firebase offers a free tier covering core analytics features. Advanced services like real-time data streaming, BigQuery exports, and high-volume usage are billed under the pay-as-you-go plan.
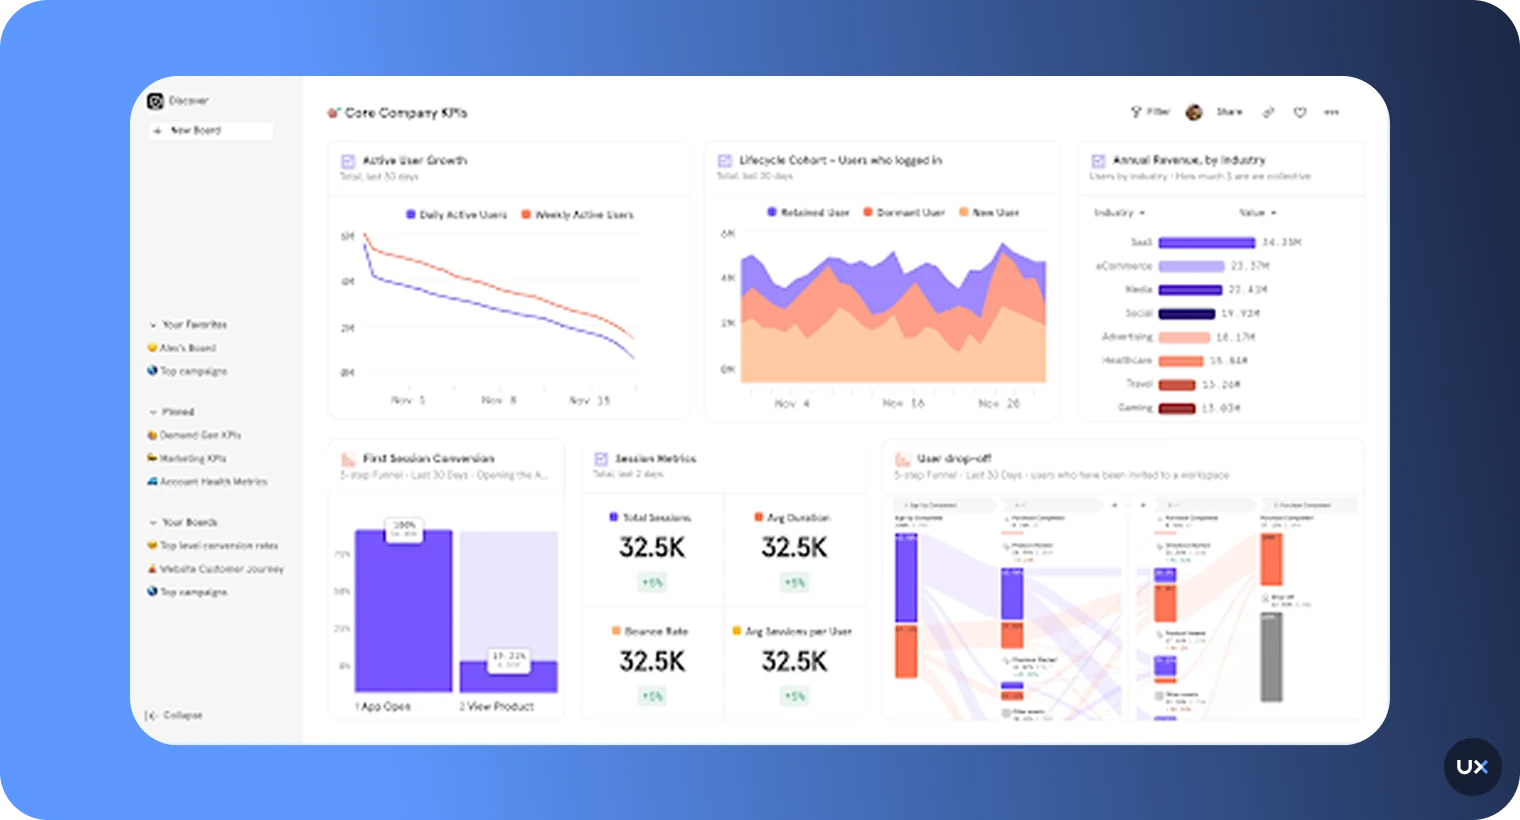
3. Amplitude


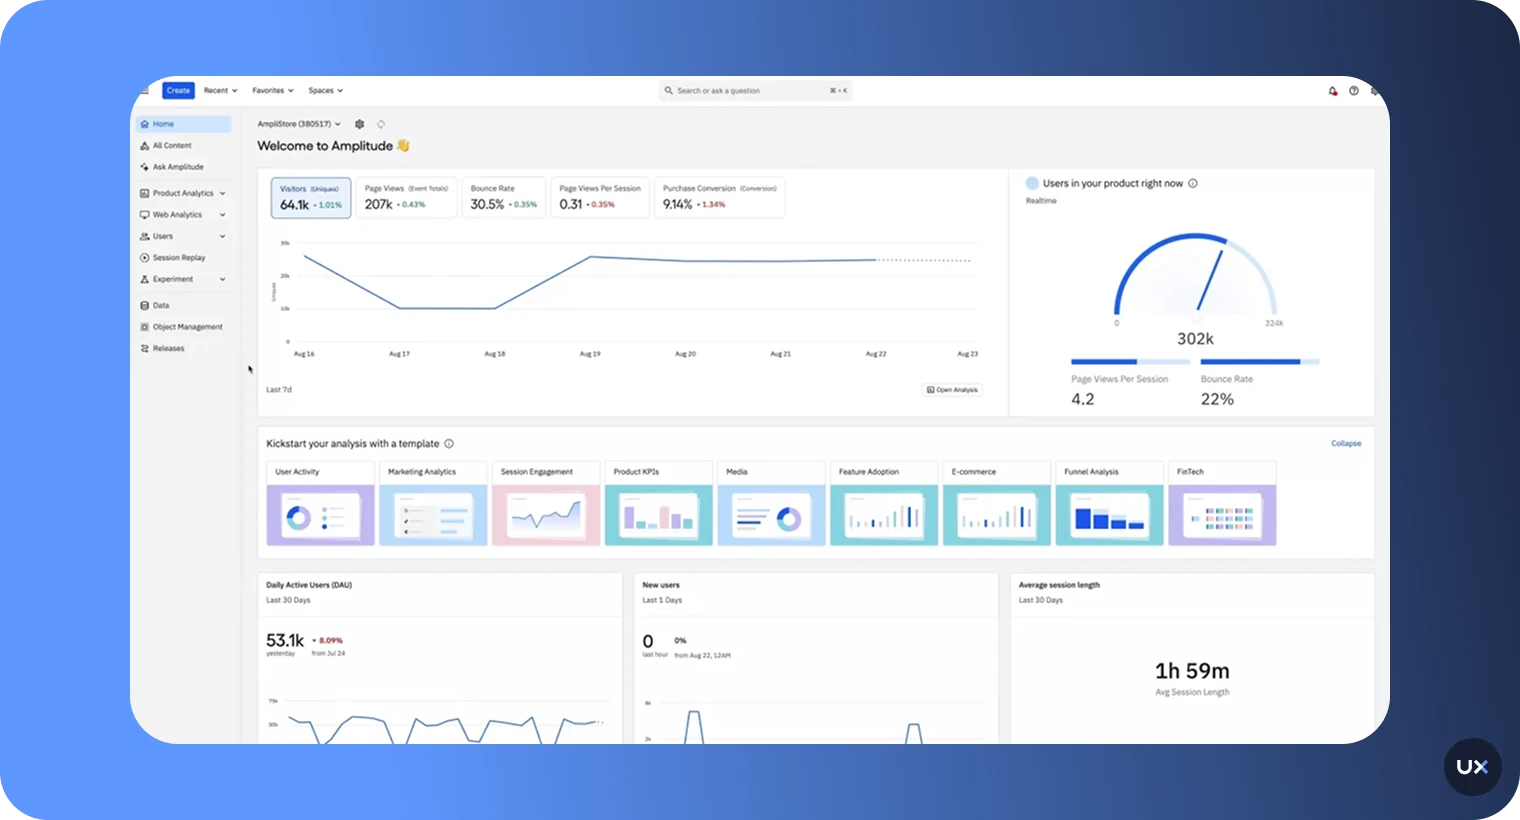
Amplitude is a product analytics platform built to help teams understand user behavior, optimize engagement, and drive retention through data. It focuses on uncovering patterns in user journeys, showing not just what users do, but how those actions impact long-term growth and conversion. It is widely used by growth, product, and marketing teams to make smarter, data-driven decisions.
Key features
Event-based tracking: Monitor user interactions across web and mobile with customizable event properties.
Behavioral cohorts: Segment users based on shared actions or traits to analyze engagement and retention.
Retention reports: Track how often users return and what features influence loyalty.
Pathfinder analysis: Visualize complete user journeys to spot trends and friction points.
Predictive analytics: Use machine learning to forecast churn risk or high-value users.
Pros
Generous free plan
Robust reporting and cohort analysis
Custom dashboards
Ideal for growth and product teams
Scalable for large teams
Cons
Doesn’t include notification features on product usage
Can be complex for new users
Expensive for smaller teams or startups
Pricing
Amplitude offers a free plan with up to 10 million monthly events, while paid plans start at around $61 per month.
4. Mixpanel


Mixpanel is a real-time product analytics tool designed to help teams understand how users interact with their apps and optimize for engagement and retention. It provides deep insights into user behavior through event tracking, funnels, and segmentation, helping teams make informed decisions without relying on SQL or data engineers.
Key features
Funnel analysis: Identify drop-off points and optimize user journeys for higher conversions.
Retention reports: Measure how often users return and which features drive loyalty.
Segmentation: Filter and analyze data by user attributes, cohorts, or behavior patterns.
A/B testing support: Evaluate the impact of product changes with side-by-side comparison.
Predictive analytics: Forecast trends like churn or purchase intent using historical data.
Pros
Intuitive web interface for analysis
You can see the live activity of the users on your site
You can send notifications on product usage
Automatic iOS event integration allows you to set events through an online visual interface
Helps you identify where users drop off in their journey so you can optimize funnels
Cons
Limited historical data access on lower-tier plans.
The analytics features are premature compared to Firebase and Amplitude
Proper implementation often requires engineering support to set up event tracking.
Pricing
Mixpanel offers a free plan with core analytics and data history, plus its Growth plan that starts at $0.28 per 1k events.
5. Appsflyer


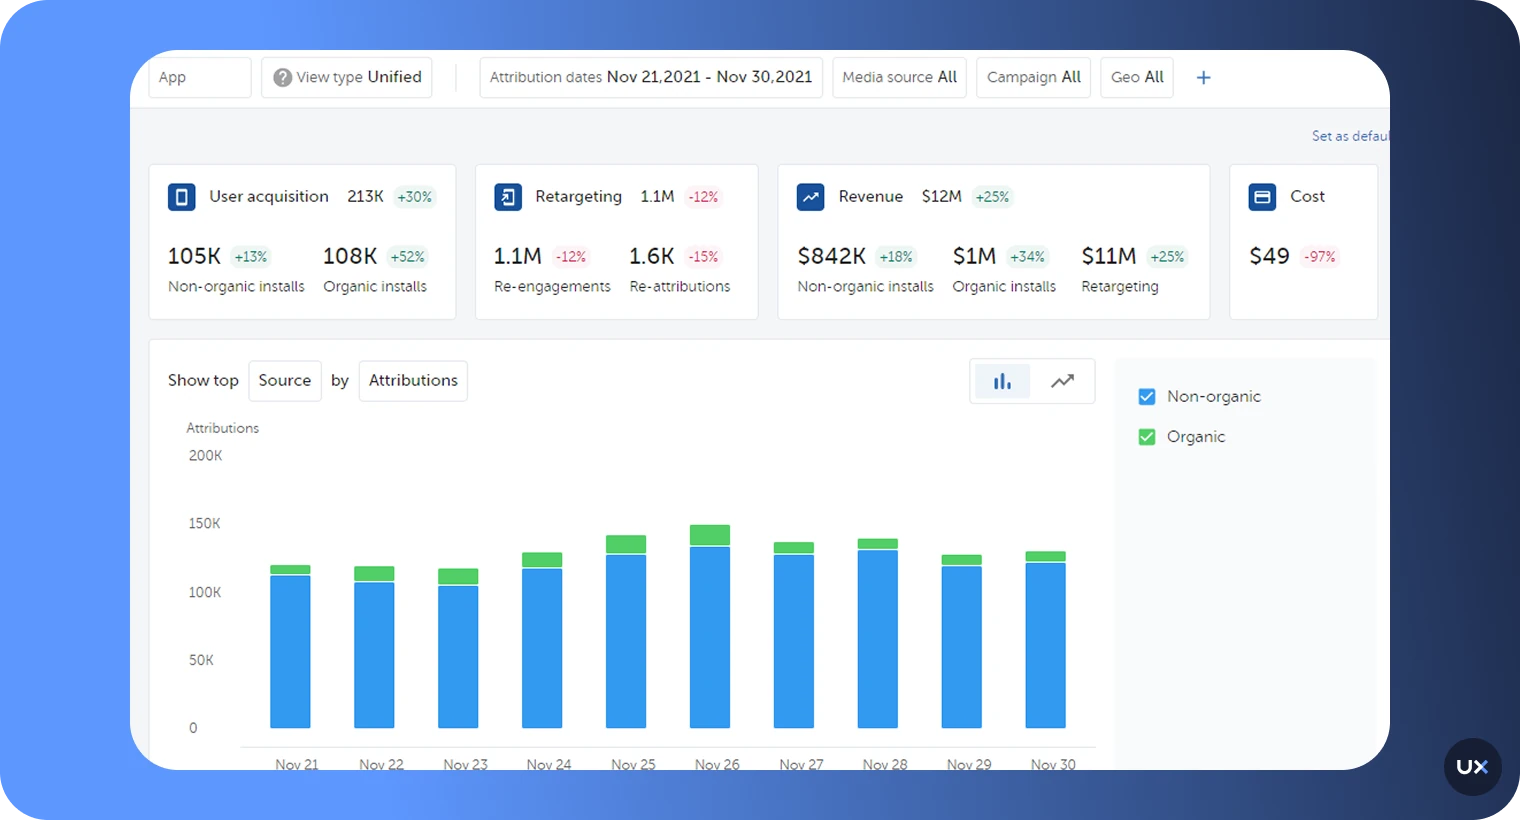
AppsFlyer is an enterprise-grade mobile attribution and analytics platform many Android teams reach for when they want accurate install attribution, cohort-level LTV, and strong fraud protection. Under the hood it’s a full marketing measurement stack (attribution, deep linking/OneLink, raw data exports, Protect360 fraud suite), but what sets your daily experience apart is not just features, it’s the workflow that makes it easy to trace installs and export your data.
Key features
Attribution & install measurement: Deterministic & probabilistic attributions for paid and organic installs.
Deep linking / OneLink: Deep links that survive install flows and support deferred deep linking.
Protect360 (fraud protection): Automated fraud detection and blocking for suspicious installs and events.
SDK & platform integrations: Android SDK with step-by-step setup and many prebuilt partner integrations (ad networks, analytics, BI).
Cohort & LTV analytics: Cohort retention, revenue, and lifetime value modeling to inform UA spend.
Pros
Has a strong install attribution and broad partner coverage.
Teams can easily filter fraudulent installs and events and save ad spend
Boosts conversions by creating smooth cross-channel journeys from web, email, and social.
Integrates with hundreds of ad networks and analytics tools with simple partner toggles.
Users can pull granular event and cohort data directly into BI tools.
Cons
The UI and configuration are dense; new users need time to get reliable outputs.
Pricing tied to conversions can ramp up unexpectedly if you don’t monitor volumes
Some teams report discrepancies when comparing AppsFlyer data to internal analytics.
Pricing
AppsFlyer uses tiered plans by feature set and conversion volume rather than a simple per-seat monthly fee. There is a Zero (free) plan for basic needs and a Growth / Custom enterprise model for paying customers.
6. Countly


Countly is an open-source mobile and web analytics platform that gives product teams full control over their data. It focuses on privacy, extensibility, and real-time insights, making it especially appealing for enterprises and developers that prefer self-hosted or hybrid deployment. Beyond basic analytics, Countly enables teams to track user behavior, measure performance, and even send personalized notifications, all in one unified platform.
Key features
Event and session analytics: Track key user actions, sessions, and engagement patterns.
Cohort and funnel analysis: Identify behavioral trends, drop-offs, and conversion opportunities.
Crash analytics: Detect app crashes and performance issues with detailed diagnostics.
Plugin architecture: Extend functionality with plugins for A/B testing, messaging, and attribution.
Push notifications: Engage users directly within the platform based on behavior or events.
Pros
Open-source and self-hosted options
Great for privacy-conscious teams
Broad platform coverage (SDK for 15+ platforms)
Excellent for custom event tracking
Detailed crash reporting
Cons
Complex setup for self-hosted options
Works with a limited set of strict server requirements
May require more technical expertise
Pricing
Countly offers a free self-hosted Lite plan, a FlexFree plan, a Flex plan starting at $40/month, and custom-priced Enterprise plans with advanced analytics, support, and scalable data options.
7. Adobe Analytics


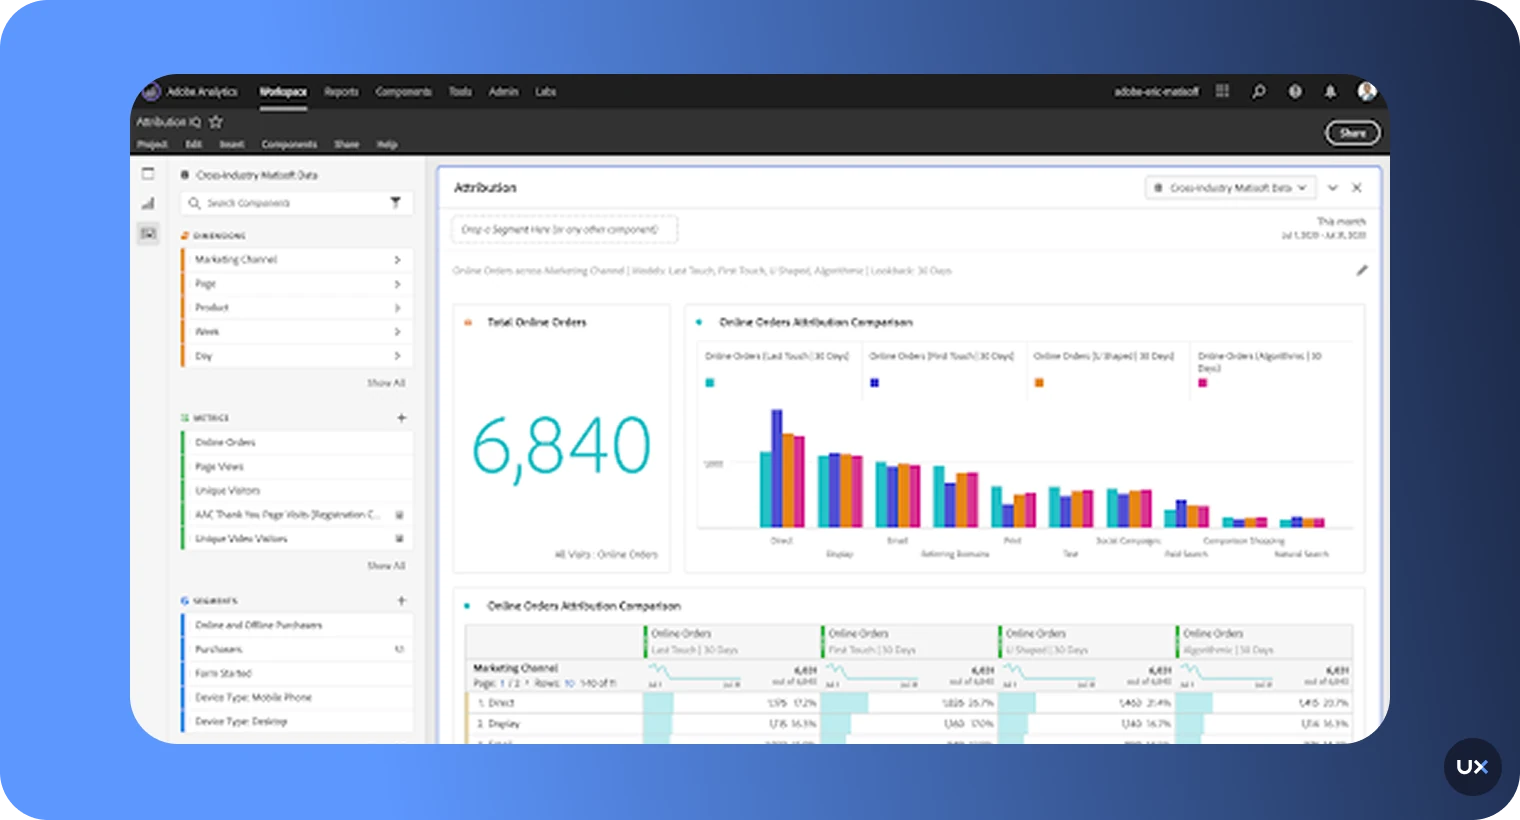
Adobe Analytics is an enterprise-grade analytics platform built to deliver advanced insights into user behavior across mobile apps, web, and other digital touchpoints. Part of the Adobe Experience Cloud, it empowers large organizations to track, analyze, and predict customer interactions using robust data models and machine learning.
Key features
Advanced segmentation: Create granular user segments with complex conditions and real-time filtering.
Attribution modeling: Identify the channels and touchpoints that drive conversions most effectively.
Flow and pathing visualization: Map how users navigate through your app or website to uncover drop-offs and friction points.
Predictive analytics: Leverage Adobe Sensei AI for automated insights and forecasting.
Custom dashboards and reports: Visualize metrics and KPIs tailored to different teams or business goals.
Pros
Comprehensive and customizable
Ideal for large enterprises
Supports cross-channel analysis
Robust predictive analytics features
Detailed reporting and segmentation
Cons
Expensive, particularly for small teams
Complex setup and implementation
Requires third-party vendors for full functionality
Pricing
Custom pricing based on usage and features
8. Localytics


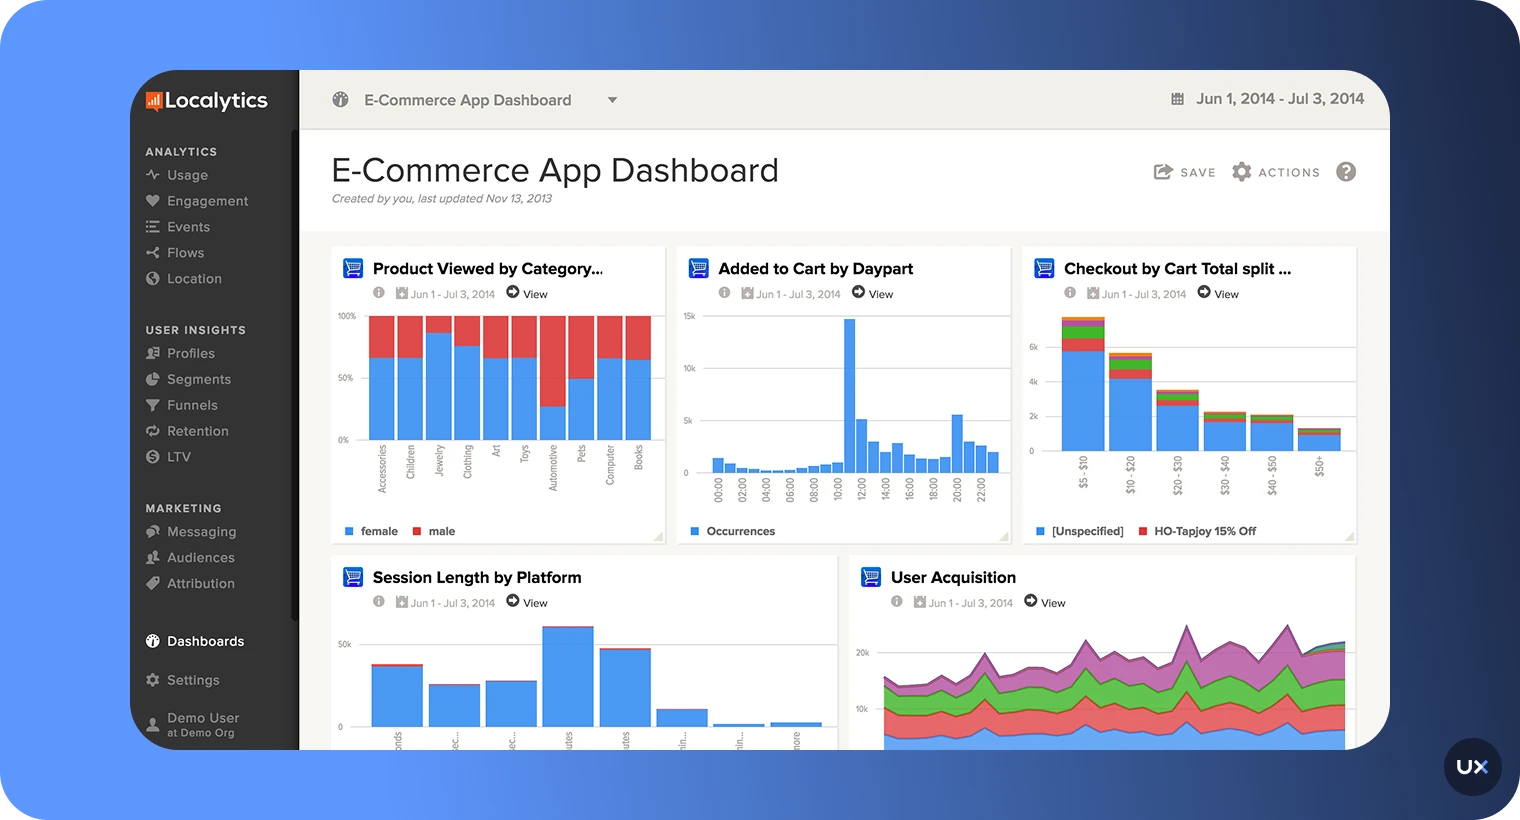
Localytics, now part of Upland Software, is a mobile app marketing and analytics platform designed to help brands increase user engagement, retention, and lifetime value. It combines behavioral analytics with personalized messaging, allowing teams to understand what users do and act on it instantly through targeted campaigns. Localytics is useful for marketers who want to connect insights with in-app engagement, push notifications, and lifecycle campaigns.
Key features
Behavioral analytics: Track how users interact with your app, including sessions, screens, and custom events.
Lifecycle tracking: Monitor users through acquisition, engagement, retention, and reactivation stages.
In-app messaging: Deliver personalized messages and prompts based on user behavior.
Push notifications: Send targeted, automated messages to boost engagement and retention.
Segmentation and targeting: Group users dynamically based on behavior, demographics, and preferences.
Pros
Combines analytics with marketing tools
Easy segmentation and targeting
Excellent for app marketers
Real-time reporting
Affordable for small to medium-sized businesses
Cons
Limited reporting capabilities
Lacks advanced behavioral insights
More focused on marketing than analytics
Pricing
Localytics offers custom pricing based on app scale, active users, and feature needs.
Optimize every user interaction with UXCam
We’ve explored the best Android analytics tools to help you understand how users engage with your app and make data-driven improvements. Each platform offers something unique, from real-time analytics to advanced segmentation, but few go beyond the numbers to show you why users behave the way they do.
UXCam bridges that gap by combining session replays, heatmaps, funnels, and AI-powered insights in one platform. It gives product, design, and engineering teams the clarity they need to uncover friction, validate UX decisions, and build experiences users love.
Start improving your app’s performance and user satisfaction, get started with UXCam for free today.
FAQ
How do I use analytics for my Android app?
Choose an analytics provider, create an account, and integrate their SDK into your app. Most platforms provide step-by-step setup guides to start collecting data quickly.
Do Android analytics tools also work for iOS?
Yes. Most analytics vendors, including UXCam, Firebase, and Mixpanel, support both Android and iOS, allowing you to track cross-platform user behavior in one dashboard.
What are the best free Android analytics tools?
The best free Android analytics tool is UXCam. Its free plan includes up to 3,000 monthly sessions, with heatmaps, session replays, and funnel analysis, giving you a complete picture of how users interact with your app.
Can I track user journeys and drop-offs in Android apps?
Yes. Tools like UXCam and Amplitude let you visualize complete user journeys and identify where users drop off, helping you improve conversions and retention.
Is UXCam suitable for Android app analytics?
Absolutely. UXCam provides comprehensive Android analytics, including session replays, heatmaps, funnels, and AI-powered insights that help you understand both the what and why behind user behavior.
What is Google Analytics for Android?
Google Analytics for Android is now part of Google Firebase, providing real-time event tracking, engagement reports, and audience insights for mobile apps.
Related Articles:
Reach Native Analytics Guide for Mobile App Teams
Top 19 Mobile App Analytics Tools in 2026
App Onboarding Guide with 10 Examples
Best User Onboarding Tools for Mobile Teams
How to Make an App Prototype - Step-by-Step Guide
Best iOS Crash Reporting Tools
Mobile App Tracking: Best Tools
AUTHOR
Annemarie Bufe
Product Analytics Expert
Passionate hobby dancer. Working at UXCam.


Related articles


App Analytics
Top 19 Mobile App Analytics Tools in 2026
Choosing the best mobile app analytics tools and platforms for your app can be overwhelming. We did the research, so you don't have...


Jonas Kurzweg
Product Analytics Expert


App Analytics
Best Android App Analytics Tools in 2026
Discover the top 8 Android analytics including UXCam, Firebase, and Flurry Analytics. Compare features, pricing, and platforms...
Annemarie Bufe
Product Analytics Expert
Curated List
Top 19 Mobile App Analytics Tools in 2026
Discover the top mobile analytics tools in 2026. Compare features, pricing, and reviews to choose the right platform for app tracking, behavioral insights, and data-driven...
Jonas Kurzweg
Product Analytics Expert