React Native Performance Monitoring Guide 2026


React Native’s dual-threaded architecture means performance issues can originate from JavaScript execution or native UI rendering. To catch real bottlenecks, teams need visibility into metrics like JS thread stalls, dropped frames, app startup time, and navigation latency.
This guide explains why performance monitoring is different in React Native and how to track it using built-in RN tools, native profilers, and production monitoring SDKs such as Flipper, Sentry Performance, and UXCam. Visit our blog for more guides on React Native crash reporting and mobile analytics for React Native apps.
What is React Native performance monitoring?
React Native performance monitoring means tracking JavaScript execution and native UI rendering at the same time. Unlike fully native apps or web apps, React Native runs across multiple layers: the JS thread, the native UI thread, and the bridge that connects them, so performance issues can originate in different places.
When users report lag, the cause isn’t always obvious. It might be heavy JavaScript work blocking the JS thread, complex native view rendering slowing the UI thread, or congestion across the bridge. Monitoring helps you pinpoint which part of the system is struggling and when it happens.
Effective monitoring also ties technical signals to real user behavior. Instead of seeing abstract metrics like “JS thread dropped to 30 FPS,” you can see that it happened when a user with a large cart tapped Checkout on a mid-range Android device.
By capturing signals like JS thread stalls, dropped frames, bridge delays, and slow navigation transitions, React Native performance monitoring shows how architectural bottlenecks translate into poor user experience.
Why performance monitoring is unique in React Native
React Native runs across multiple execution layers
React Native apps don’t run in a single execution environment. Instead, they operate across multiple layers that must stay in sync for the app to feel smooth. This is what makes performance monitoring in React Native different and more complex than in fully native apps.
As of 2026, React Native has fully transitioned to the New Architecture, replacing the legacy asynchronous Bridge with the JavaScript Interface (JSI). Unlike the old model, JSI allows for synchronous, direct communication between the JavaScript and Native layers through Fabric (the new UI renderer) and TurboModules. Fabric components speed up rendering via a modern pipeline, enabling smoother lists and snappier gestures, while TurboModules allow for lazy-loading and direct C++ access. This shift eliminates many traditional bottlenecks but introduces new monitoring requirements for concurrent state updates and JSI execution.
The Bridge introduces additional performance risk
In many production apps, communication between JavaScript and native code happens through the Bridge. These calls are asynchronous and serialized, which introduces overhead.
When JavaScript requests something from native code, such as location, storage, or camera access, the request crosses the Bridge, executes on a native thread, and then returns before the UI can update. Repeated or frequent calls can add latency and cause visible delays.
Performance issues can originate on either side
Because of this architecture, performance problems can come from different places. A slow tap response might be caused by heavy JavaScript work blocking the JS thread. Dropped frames can result from slow native rendering on the UI thread. Navigation jank may appear when Bridge communication backs up and delays updates.
To users, these issues often look the same. The app feels slow, but the root cause isn’t obvious without deeper visibility.
Monitoring must be architecture-aware
This is why React Native performance monitoring has to go beyond surface-level metrics. It needs to track what’s happening on the JavaScript thread, inside native modules, and across the Bridge at the same time.
Without that context, teams can see the symptoms but miss the cause.
Architecture-aware monitoring makes it possible to understand where performance breaks down and why users experience lag, even when individual components seem fine on their own.
How can performance problems emerge from either thread?
React Native’s split architecture introduces performance bottlenecks that don’t exist in purely native or web apps. Because work is divided across the JavaScript thread, the native UI thread, and the Bridge between them, slowdowns can originate in different places, even when everything looks fine on the surface.
JavaScript thread bottlenecks
The JavaScript thread is where React components render, state updates run, and logic such as reducers and effects execute. When this thread is blocked, the entire React reconciliation process slows down.
The useEffect hooks don’t execute, setState calls queue up, and layout updates can’t be sent to native, even if the UI thread is idle and ready to render. To users, this shows up as delayed taps, frozen screens, or navigation that feels stuck.
UI thread bottlenecks
The UI thread is responsible for native rendering and gesture handling. Native view managers, layout results from the Shadow thread, and platform-specific rendering (UIKit on iOS, Android Views on Android) all run here.
Even when the JS thread is healthy, the UI thread can become overloaded. Complex FlatList setups with custom native components, large image decoding in <Image> elements, or heavy Animated.Native transitions can all cause dropped frames. In these cases, JavaScript may report a steady 60 FPS, while the UI visibly stutters.
Bridge serialization delays
In apps using the Bridge architecture, every prop update, event callback, and native module call is serialized to JSON and sent asynchronously between threads.
This becomes a problem when events fire frequently. A fast-scrolling ScrollView, for example, can generate hundreds of scroll events per second. Each event must serialize, queue, deserialize, and trigger JavaScript handlers. Over time, this creates noticeable lag between the user’s finger movement and what appears on screen.
Navigation-related thread conflicts
Navigation can expose thread-level bottlenecks very quickly. React Navigation performs screen mounting and unmounting on the JS thread, while native navigators initialize views on the UI thread.
When transitions feel slow, monitoring helps reveal whether the delay comes from JavaScript, such as parsing a large bundle or mounting complex components, or from native work like allocating memory for new view hierarchies.
Why this matters for monitoring
Because these issues surface in similar ways, a “slow screen” diagnosis isn’t possible without knowing which layer is blocked. The JS thread might be stalled processing React components. The UI thread might be overwhelmed, rendering native views. Or the Bridge might be congested, moving data between them.
That’s why React Native performance monitoring must track all three layers at the same time. Without that visibility, teams see the symptom but miss the real cause. Stop playing detective with your performance. Instead of guessing which thread is blocked, you can now ask Tara AI: “Why did the JS thread stall during checkout flow?” She watches the sessions for you and translates raw behavior into actionable fixes in seconds.
What to monitor in a React Native app
Track these React Native-specific performance indicators to diagnose issues:
JS thread frame rate: Measures how quickly the JavaScript thread processes work. Should stay at 60 FPS for smooth interaction. Drops indicate heavy computation, excessive re-renders, or Bridge congestion blocking the JS thread.
UI thread frame rate: Measures native rendering performance. Drops indicate complex view hierarchies, expensive native animations, or image/video decoding issues.
Bridge traffic volume: Serialization overhead from excessive data crossing between JS and native. High traffic correlates with scroll lag, animation stutters, and input delays.
Long tasks on the JS thread: Any JavaScript execution exceeding ~16 ms (the frame budget at 60 FPS) risks dropping frames. Identify which functions block the thread.
App startup time (TTI): Time to Interactive measures how long users wait before the app responds to input. Includes native module initialization, JS bundle load, and initial render.
Memory usage and leaks: JS heap size, native memory allocation, and memory growth over time. React Native apps can leak in both realms.
Navigation latency: Time between triggering navigation and the new screen becoming interactive. Slow navigation frustrates users more than slow initial loads.
Network waterfall impact: API request timing affects perceived performance even when the app renders smoothly. Slow or sequential requests delay data-dependent screens.
These metrics differ from native app monitoring (which tracks single-threaded performance) and web analytics (which focus on load times and DOM rendering). React Native monitoring requires visibility into both JavaScript execution and native rendering simultaneously.
How to monitor performance in React Native
Development monitoring with built-in tools React Native includes a performance monitor accessible through the dev menu. It displays live JS and UI thread frame rates, useful for spot-checking during development. However, it only shows current values, making it difficult to correlate drops with specific user actions or code paths.
The React DevTools Profiler, integrated with Flipper, records which components render, how long each render takes, and why they rendered. Use it to identify excessive re-renders or expensive component trees blocking the JS thread. Flamegraph views show where time is spent during a commit.
Development profiling with Flipper Flipper provides several plugins for React Native performance analysis. The Performance plugin visualizes traces on a timeline, showing JS execution, native operations, and bridge traffic. The flipper-plugin-react-native-performance calculates a Lighthouse-style score and tracks frame rates over time.
Flipper helps during development, but cannot monitor production apps. You need production-ready SDKs for real user monitoring.
Native profilers for deep diagnosis When Flipper and React DevTools indicate a UI thread problem, use Android Studio's System Trace Profiler or Xcode Instruments to profile native code. Android Studio's CPU Profiler shows which native methods consume time. Xcode's Time Profiler reveals iOS-specific bottlenecks like CoreAnimation rendering or memory allocation spikes.
These tools require running your app through Android Studio or Xcode and capturing traces during the problematic interaction. They provide the deepest visibility but are impractical for production monitoring.
Production monitoring with specialized SDKs For production monitoring, integrate lightweight SDKs that capture performance data from real users without impacting app performance.
Options include:
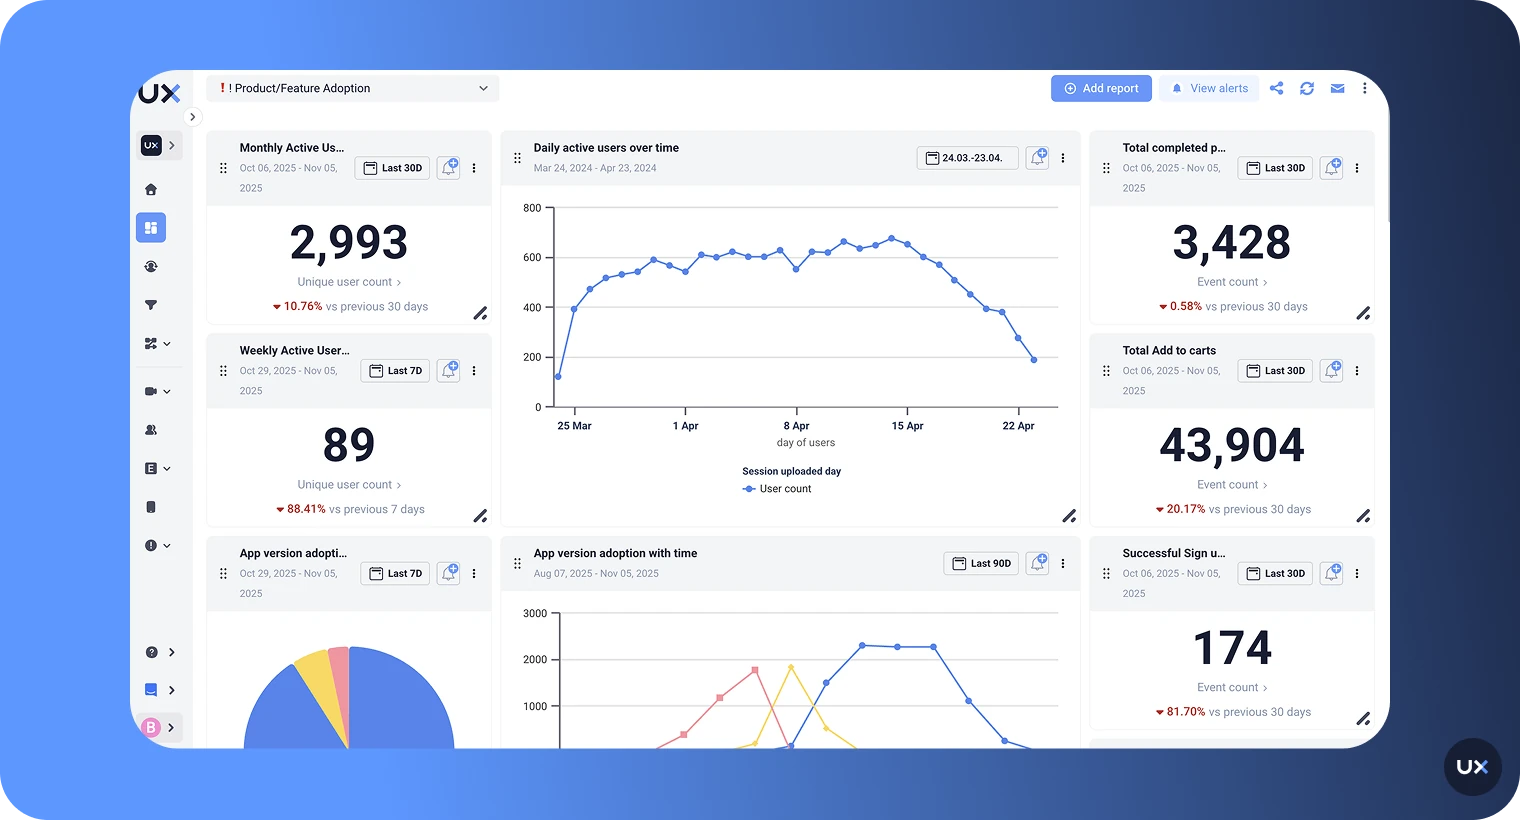
UXCam: Combines performance metrics with session replay, showing exactly how users experience lag. Visualize where dropped frames occur in user flows, correlate performance degradation with specific screens, and see real user sessions affected by performance issues.
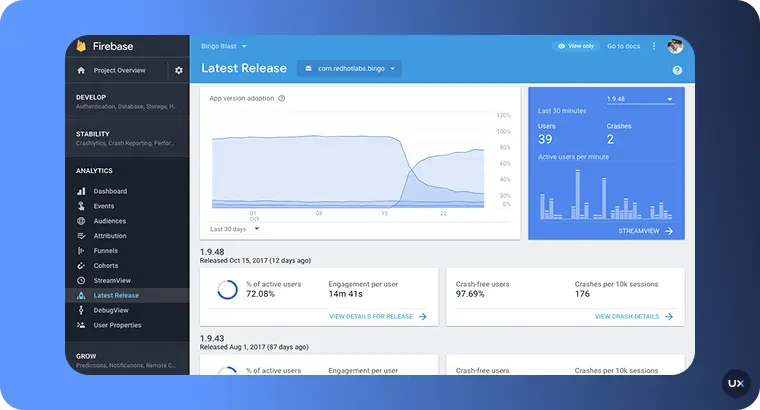
Firebase Performance Monitoring: Automatically collects app startup time, screen rendering, and network request latency. Supports custom traces for specific code paths.
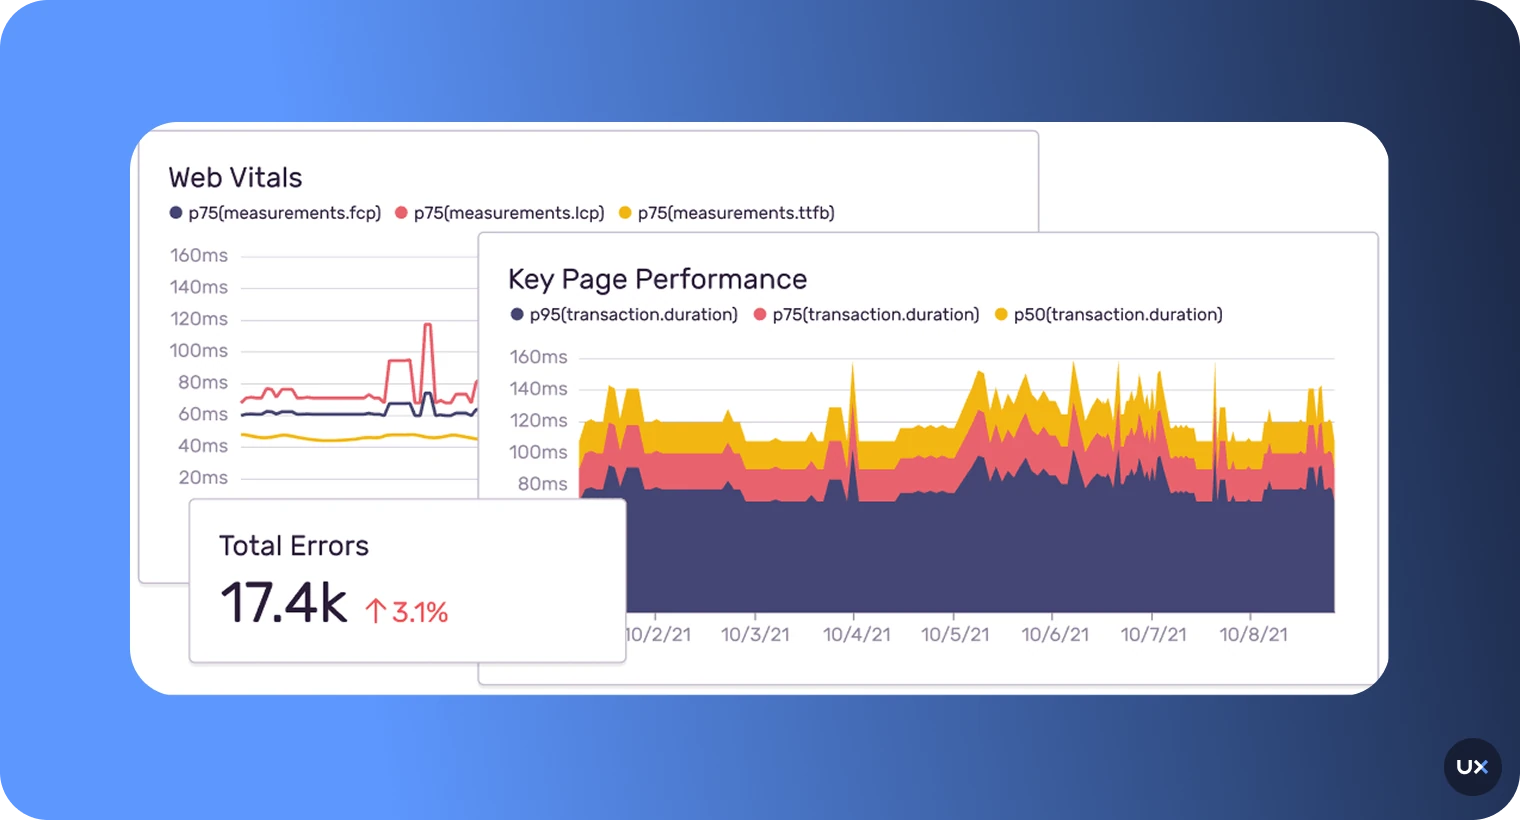
Sentry Performance: Tracks transactions and spans, correlating performance with errors. Captures JS thread execution time, network waterfalls, and slow operations. Integrates with React Navigation for automatic screen change tracking.


UXCam for React Native performance insights
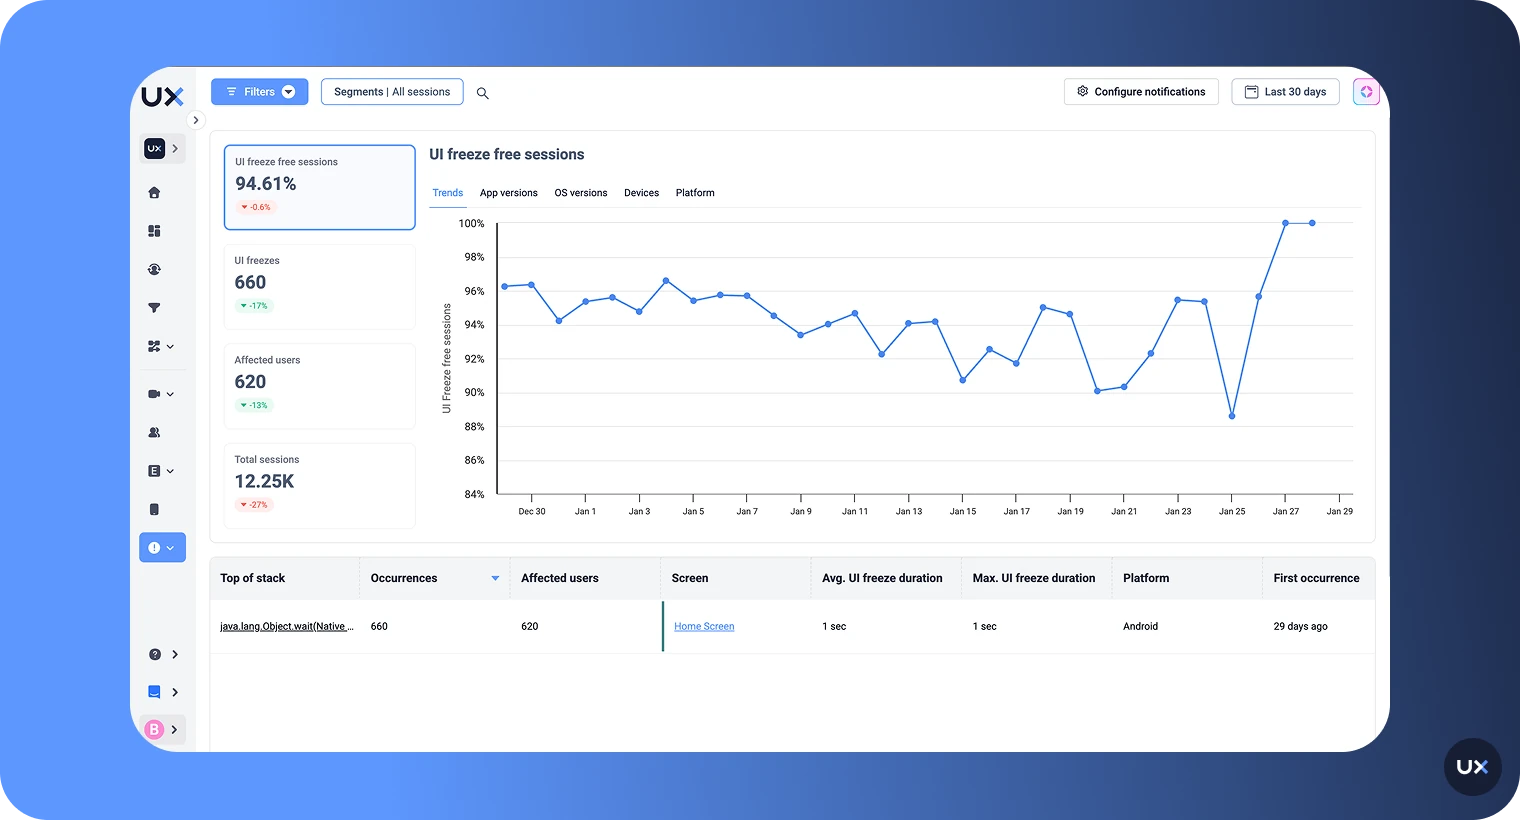
UXCam contextualizes performance problems by showing how users actually experience lag or slow screens. When your monitoring dashboard reports a spike in slow screen loads, UXCam's session replay reveals what users were doing when the lag occurred. You can watch the exact gestures, screen transitions, and interactions that triggered the delay.
Instead of relying on abstract metrics like “the checkout screen took 4.2 seconds,” you uncover precise, actionable insights, such as:
Lag occurring only on Android 11 devices
Performance degradation when users add more than 20 items to their cart
Delays triggered after tapping “Place Order” during peak traffic hours
This session-level context transforms performance monitoring from diagnostics into action. Filter sessions by performance thresholds to find patterns: all sessions where navigation took longer than 2 seconds or where the JS thread frame rate dropped below 30 FPS. While dashboards provide raw data, Tara AI provides actionable insights. Tara watches thousands of performance-heavy sessions in parallel to spot recurring friction—such as UI freezes exclusive to specific Android versions—and recommends precise action plans so you don't have to manually review every recording.
Each filtered session plays back as a video, showing exactly where delays impact user flows, whether it's during onboarding, checkout, or feed scrolling. Integrate the UXCam React Native SDK to connect technical performance metrics with real user behavior.
How to improve react native app performance with UXCam
Prioritize by considering business impact and user experience This approach helps you focus on the most critical issues that could affect the overall performance of your app. For instance, you can use UXCam to identify and solve problems that impact key processes in your app and prevent users from converting.
You can achieve this by logging critical events that occur during the purchase process, which can aid in debugging and issue resolution.
For example, in the case of a food delivery app, logging key events such as the processing of a delivery request, granting of location permission, app online status, and successful request completion can provide valuable insights into the app's performance and highlight any bottlenecks or failure points.
When analyzing the purchase funnel in UXCam, you can then easily identify any drop-offs at a specific step and drill down further into those sessions to analyze app logs and pinpoint if any of the actions or requests were not executed correctly. This can help you fine-tune the performance of your application and ensure that users have a seamless and satisfying experience.
Improve error analysis and debugging time
A key benefit of using UXCam for React Native app performance monitoring is the ability to augment app logs with real session recordings to visualize user sessions, including gestures, actions, screen transitions, device properties, and network details.
Furthermore, operating systems such as Android can provide useful logs that can be instrumental in debugging application performance issues. For instance, when a particular code execution on the main thread takes too long, causing the UI to lag, the OS may print a message such as "Skipped 55 frames! The application may be doing too much work on its main thread."
By analyzing these logs in conjunction with session replays and user experience data captured by UXCam, developers and product managers can gain deeper insights into the issue and evaluate its impact on the user experience. This not only helps to understand the general performance of the app but also uncovers problems with the user experience, which can be prioritized accordingly. Prioritize fixes by impact with Tara. Tara AI helps bridge the gap between technical warnings and actual user frustration. When the OS logs 'Skipped frames,' Tara summarizes the actual impact on user flows, identifying specific rage taps and drop-offs to help you instantly prioritize the performance fixes that cause the most real-world pain
Analyze login failures and identify suspicious behavior
Using UXCam to analyze warnings triggered during sessions, such as login failures, security verifications, and invalid parameters, you can gain deeper insights into user behavior and identify potential security threats.
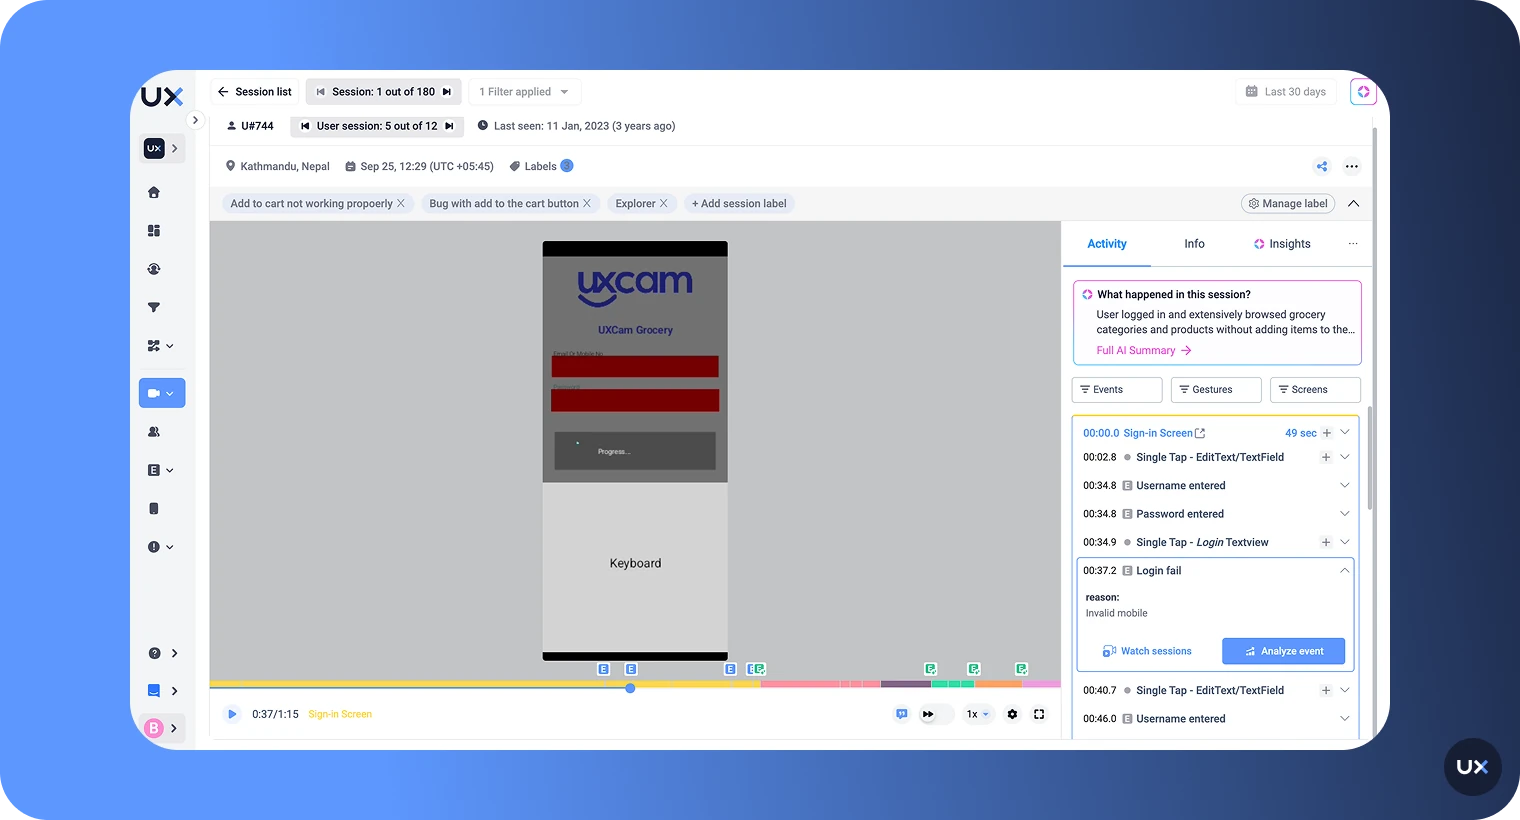
By using the log authentication events, you can further analyze login issues and identify suspicious behavior or attack attempts. This includes analyzing the login method, number of attempts, and login failures, and printing additional data to understand the reasons for the failure and pinpoint any vulnerabilities.
Moreover, app logs can be used to detect suspicious activity in near real-time, such as a high number of failed login attempts within a short time period. If such events are followed by a successful login, you can prioritize and investigate the issue with urgency.
To monitor the behavior and activity, you can label the user, gather all the details about the device, location, etc., and combine this with the information provided by the app logs to investigate further and fix any vulnerabilities. This proactive approach to monitoring and detecting suspicious activity can help ensure the security and reliability of the application for users.
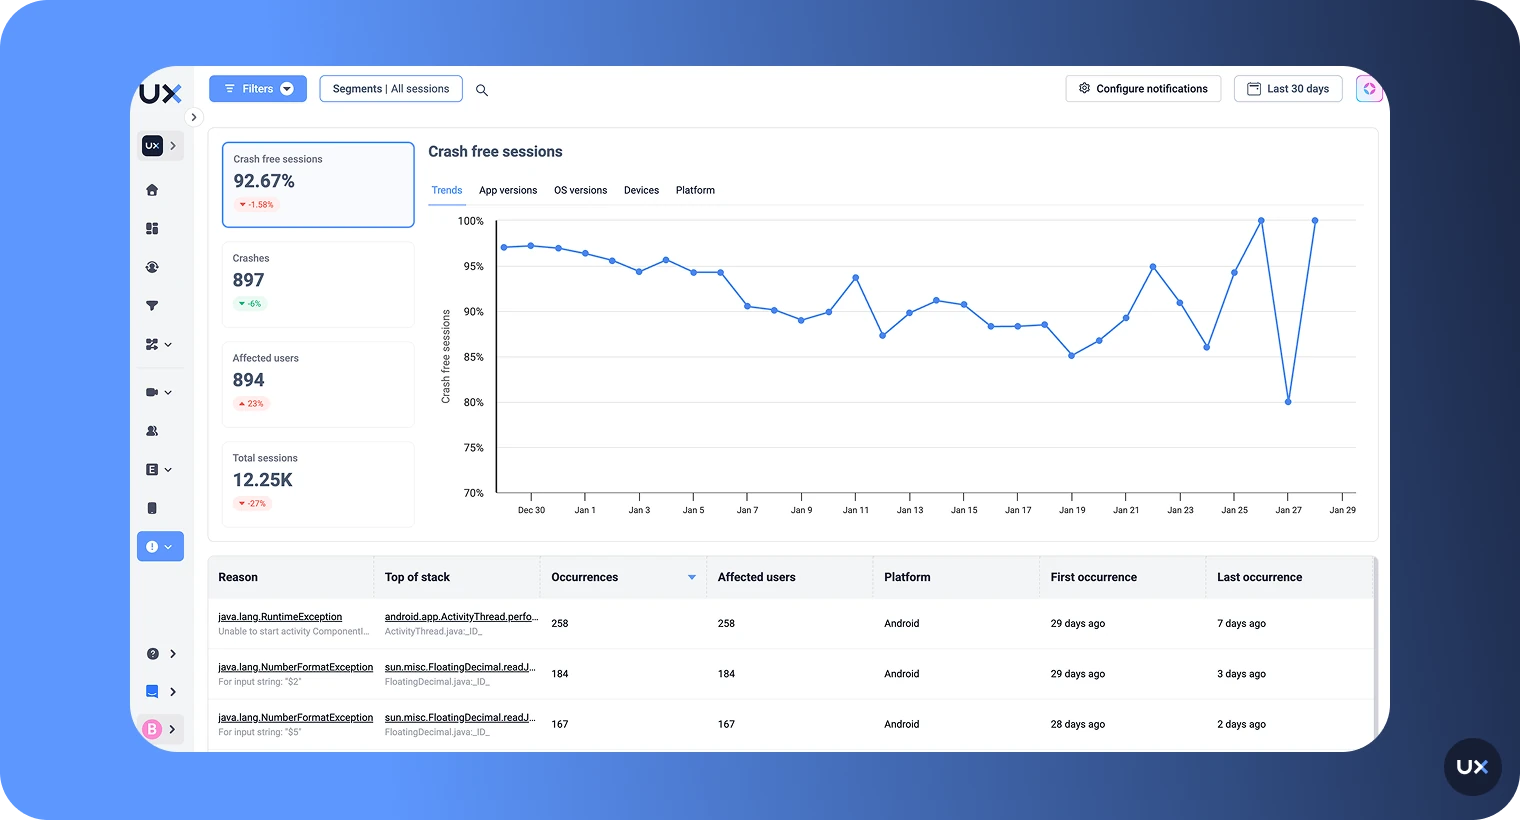
Analyze handled exceptions to identify user experience impact With UXCam, you can log the exceptions that were caught in your React Native app to aid in debugging and gain insights into how these exceptions impact the user experience and app performance.
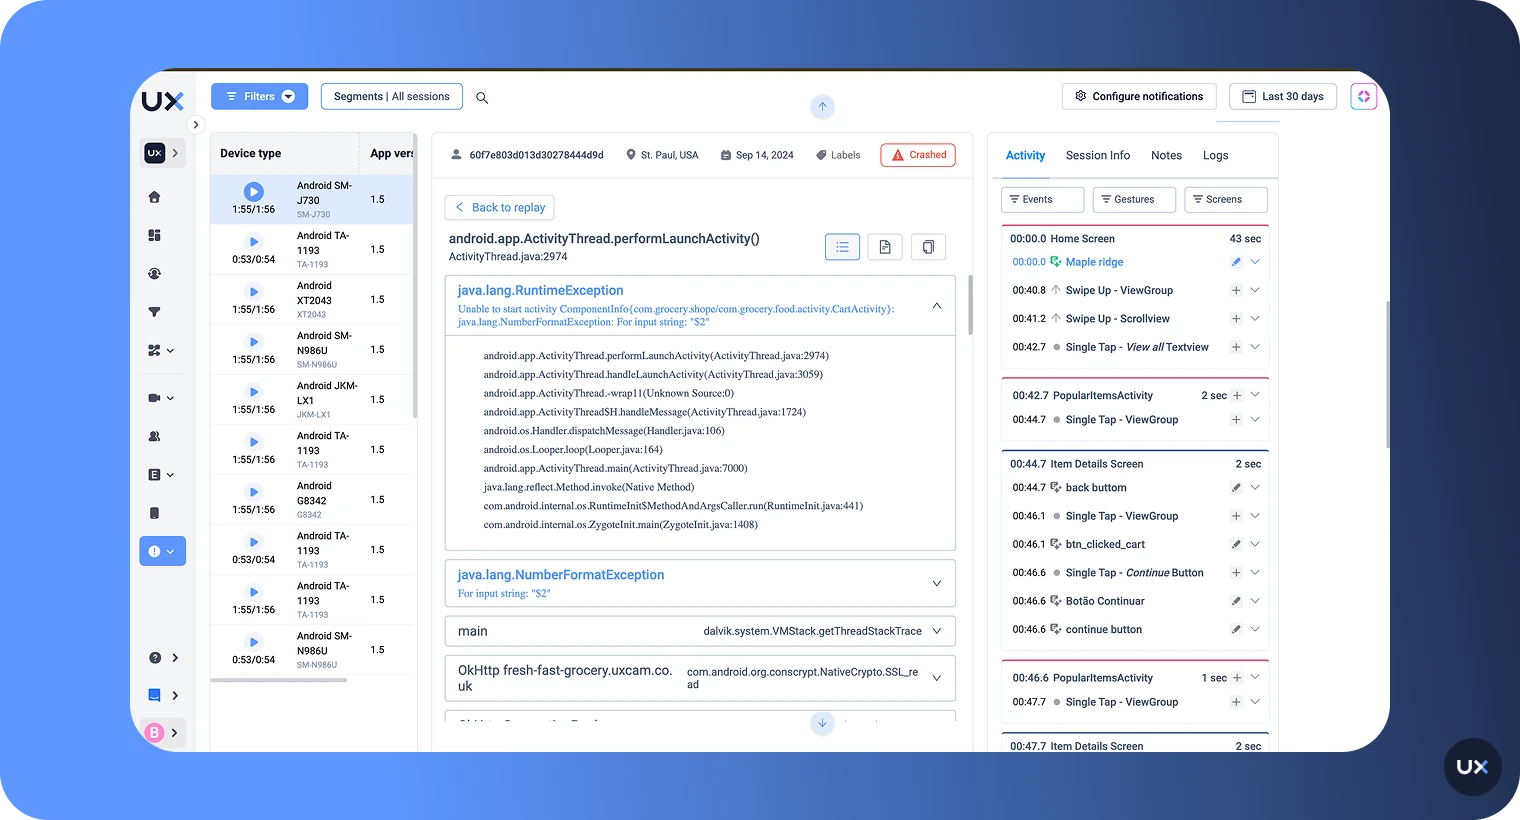
By analyzing the stack trace of the exceptions with the app logs, your developers can identify the root cause of the issue and handle it with ease. For example, if a third-party library was added to the app and an error occurred due to incorrect inputs being sent to that library, the app will print a stack trace indicating the problem.
With app logs and session replay, you can analyze the exception, understand which interaction in the app caused it, and determine its impact on your app and features. By doing so, your dev team can handle these exceptions more gracefully, improving the overall user experience and app performance.


Best practices for using UXCam for React Native app monitoring
Identify key KPIs: Before using UXCam, identify the key KPIs that will help you track the performance of your application.
Set up user events: Use UXCam's user event tracking feature to track user actions that are important to your KPIs.
Use session replay: Watch session replays to identify issues that might affect the performance of your application.
Optimize user flows: Use conversion funnel data to optimize React Native app user flows and improve the overall user experience.
Resolve issues quickly: Use UXCam's crash reporting feature to resolve issues quickly and keep your application running smoothly.
Common React Native performance monitoring use cases
Identifying lag in gesture-heavy screens
A social app sees complaints about choppy scrolling in the feed. Frame rate monitoring reveals the UI thread drops from 60 to 40 FPS during fast scrolls. Session replay shows that the lag happens when videos start auto-playing. Investigation reveals video decoding runs on the UI thread. The team moves decoding off-thread, verified by subsequent monitoring showing a stable 60 FPS.
Validating performance after a release
After adding a new analytics library, the team monitors the cold start time. Production data shows the startup increased from 1.8s to 2.5s on Android. The culprit, the library, initializes synchronously during app launch. Moving initialization to after the first render drops startup time back to 1.9s.
Detecting slow onboarding flows
Users abandon signup at 40% completion. Screen transition monitoring reveals that the phone verification screen takes 4 seconds to become interactive on 15% of sessions. This only happens when users have poor networks, and the screen waits for an SMS verification code before rendering. Adding a loading state and making the verification asynchronous reduces abandonment to 25%.
Diagnosing issues on lower-end Android devices
An app performs well on iPhone and high-end Android devices but lags on budget devices. Device-segmented monitoring shows JS thread stalls exceed 500 ms on devices with less than 3GB RAM. The issue traces to large JSON responses being parsed on the JS thread. Implementing incremental parsing reduces stalls to under 100 ms.
Monitor real React Native performance issues with UXCam
React Native performance problems are rarely obvious. A slow screen, dropped frames, or delayed navigation can come from the JS thread, the UI thread, or the communication between them. Without clear visibility into where delays occur and when users feel them, teams risk chasing symptoms instead of understanding the real cause.
UXCam helps connect low-level performance signals to real user behavior. By showing how performance issues appear inside actual user sessions, teams can see where lag impacts key flows and which interactions are affected across devices and platforms.
If you want clearer insight into how React Native performance issues affect real users, get started with UXCam and monitor performance in the context that matters most.
Frequently Asked Questions
FAQ
How do I detect JS thread stalls in React Native?
Monitor the JS thread frame rate using the built-in Performance Monitor or Flipper during development. In production, tools like Sentry track long tasks exceeding 50–100 ms. Drops to 0 FPS indicate a blocked JS thread; correlate these stalls with user actions to pinpoint expensive interactions.
How can I see dropped frames in my app?
The React Native Performance Monitor shows real-time frame rates for both threads. For historical data, use Flipper or production SDKs that report FPS metrics. Frame drops appear below 60 FPS (or 120 on ProMotion), and UXCam session replay marks them on the timeline to show exactly where users experienced lag.
How does monitoring differ on Android vs. iOS in React Native?
Both platforms share the JavaScript thread model but differ natively. Android handles complex UI layouts; iOS benefits from stronger GPU acceleration. Android Studio profiles Java/Kotlin and ART GC, while Xcode Instruments handles Objective-C/Swift and CoreAnimation. FPS metrics are similar, but budget Android devices often lag behind equivalent iPhones.
Does monitoring impact app performance?
Development tools like Flipper add overhead, so profile in release mode for accuracy. Production SDKs use sampling and async reporting, typically adding under 1–2% overhead. Avoid logging every event; focus on critical user flows and validate impact by comparing metrics with and without the SDK enabled.
Or use tools like UXCam's Tara AI to track critical user flows and issues without needing event tagging.
Monitor what users actually experience with UXCam
React Native introduces performance challenges distinct from native or web apps, requiring monitoring of both JavaScript execution and native rendering. Effective monitoring also means understanding Bridge-related bottlenecks and tying technical metrics to real user impact.
Use development tools like the Performance Monitor and React DevTools to catch issues early, then add production tools such as Firebase Performance, Sentry, or UXCam to see how real users experience the app. Metrics matter, but context is what makes them actionable, knowing where, when, and who is affected turns performance data into clear fixes.
Monitor what users actually experience with UXCam. Get started with UXCam’s React Native SDK to monitor performance with full user session context and Tara’s AI-powered analysis to turn raw data into high-impact product decisions
Related Articles
AUTHOR
Tope Longe
Product Analytics Expert
Ardent technophile exploring the world of mobile app product management at UXCam.


Related articles


Product Management
Say hello to new funnels: Analyzing app conversion rates just got easier
UXCam's updated funnels make analyzing conversions easier than ever with new conversion criteria and funnel...


Jane Leung
Product Analytics Expert
Conversion Analysis
React Native Performance Monitoring Guide 2026
Master React Native performance monitoring. Track JS thread stalls, dropped frames, and bridge lag with AI insights from Tara to ship a faster, smoother...
Tope Longe
Product Analytics Expert


Conversion Analysis
Top 51 Mobile App KPIs: Ultimate List 2026
51 mobile app KPIs — determine the KPIs and metrics that matter the most for your...


Jonas Kurzweg
Product Analytics Expert