How to retain users in a recession with UXCam

In today’s uncertain market conditions, the days of growth at all costs are behind us. In the last few years, startups were growing at breakneck speed. Investment was flowing more freely into the user acquisition funnel. Now, there’s mounting evidence that suggests we’re in a period of uncertainty after a year of hypergrowth.
The focus for modern product teams has shifted to retention, reducing churn, and maximizing lifetime value to ‘recession proof’ their business. Sustainable product management styles are back in vogue to boost black and white profitability rather than pure user growth.
For product managers, the challenges of retention can root from a lack of experience in gathering large volumes of user behavior data and communicating changes in the team.
Fortunately, you no longer need to be a data analyst to track, measure, and analyze retention. But, you do need UXCam.
Here are core challenges to retention and how UXCam solves them for you.
Challenge #1: Time spent on manual tracking of retention events
Solution: UXCam tagless autocapture gathers all the user behavior, device, and technical issue data with a single snippet of code.
Challenge #2: Understanding why users aren’t staying on the app
Solution: Pure numbers or quantitative analytics tells half the story. These days it’s not just about ‘how many customers are churning?’ but ‘why are users leaving us?’ With UXCam you can click from the product to experience analytics and go from the what to the why in a single platform.
Challenge #3: Poor user experience and longer feedback loops to CS and engineering
Solution: UXCam enables you to see the full context of the user experience and was built for teams to work together.
We’ll show you exactly how to overcome these challenges with just one solution:
Challenge #1: Time spent on manual tracking and lack of experience in data
One of the biggest challenges to retention and user churn is the tracking itself. Manual instrumentation alone is time consuming and doesn’t always give accurate results. Usually, it looks like this:
Product manager has a hypothesis and tells BI what they want to track
Business Intelligence says how the tagging needs to look
Engineer writes properties and executes the tracking.
Solution: Tagless auto capture for user behavior data in your mobile app
Without any manual instrumentation, and based on auto captured user behavior, technical issues, and screen properties (see full chart below), you can already answer retention and engagement questions like:
Screen behavior
Which screens are users most engaged with?
What parts of the screen are unresponsive?
Where do they spend most of their time?
Which screen’s have the highest quit rate?
What are the most common paths users follow in my app?
Which screens have the highest crash rates or UI freezes?
Which screens have the highest engagement time?
What features or screens in my app are most frustrating for users? (you can tell with rage taps per screen)
Technical questions
Where do I have the highest crash rate on my screen?
What are the most common interactions (gestures) used when interacting with my app?
Which platform versions are performing better or worse with your app? (in Heap you can’t filter by platform)
User properties
Which are the top devices users are using?
Which devices are performance best vs least
What app version has the highest crashes?
Compare iOS vs Android when it comes to crashes, UI freezes and handled exceptions
What makes this possible? The sheer variety of auto captured data the second you integrate UXCam:
| User behavior data | Technical issues | Screen properties |
|---|---|---|
| Rage taps | UI freezes | Screen name on native apps |
| Double taps & single taps | Crashes | Screen size & resolution |
| User zooms | Handled exceptions | We also have all the user and session property info (location of user or session, internet carrier used, OS used, app and OS version used |
| User scrolls | App logs | Device property info (device manufacturer, size, etc) |
| User swipes | Technical error logs for every unique issue type captured (from the above 3 categories) | |
| Long presses (on screen) | ||
| Unresponsive gestures | ||
| First gesture (on specific session) | ||
| Last gesture (on specific session) |
Autocapture collects everything so you can generate questions and answers about your products that help you empathize with your users. Combined with the session replays and heatmaps it automatically generates, autocapture fills the gap between capturing user data and making sense of it.
Get the complete guide to mobile app heatmaps.
Challenge #2:Understanding why users are quitting the app
When it comes to understanding why users leave, we start with the ‘what’ quantitative analytics (the graphs and funnels driven by hard numbers) and end with the ‘why’. For a crash course on app analytics, check out our pocket guide. The ‘why’ is the experience analytics that give us the full context of user behavior, think session replays and heatmaps.
Most product analytics tools will give you the what. You’ll be able to see on a funnel or on a graph that users aren’t converting, but you’ll often have to pair that data with external qualitative analytics (surveys, user interviews, etc.) to understand the full context.
Solution: With UXCam, we connect the what to the why since we have both product and experience analytics in a single solution. Here are the fundamental steps to identifying why users are dropping off of your app:
1. Analyze the journey


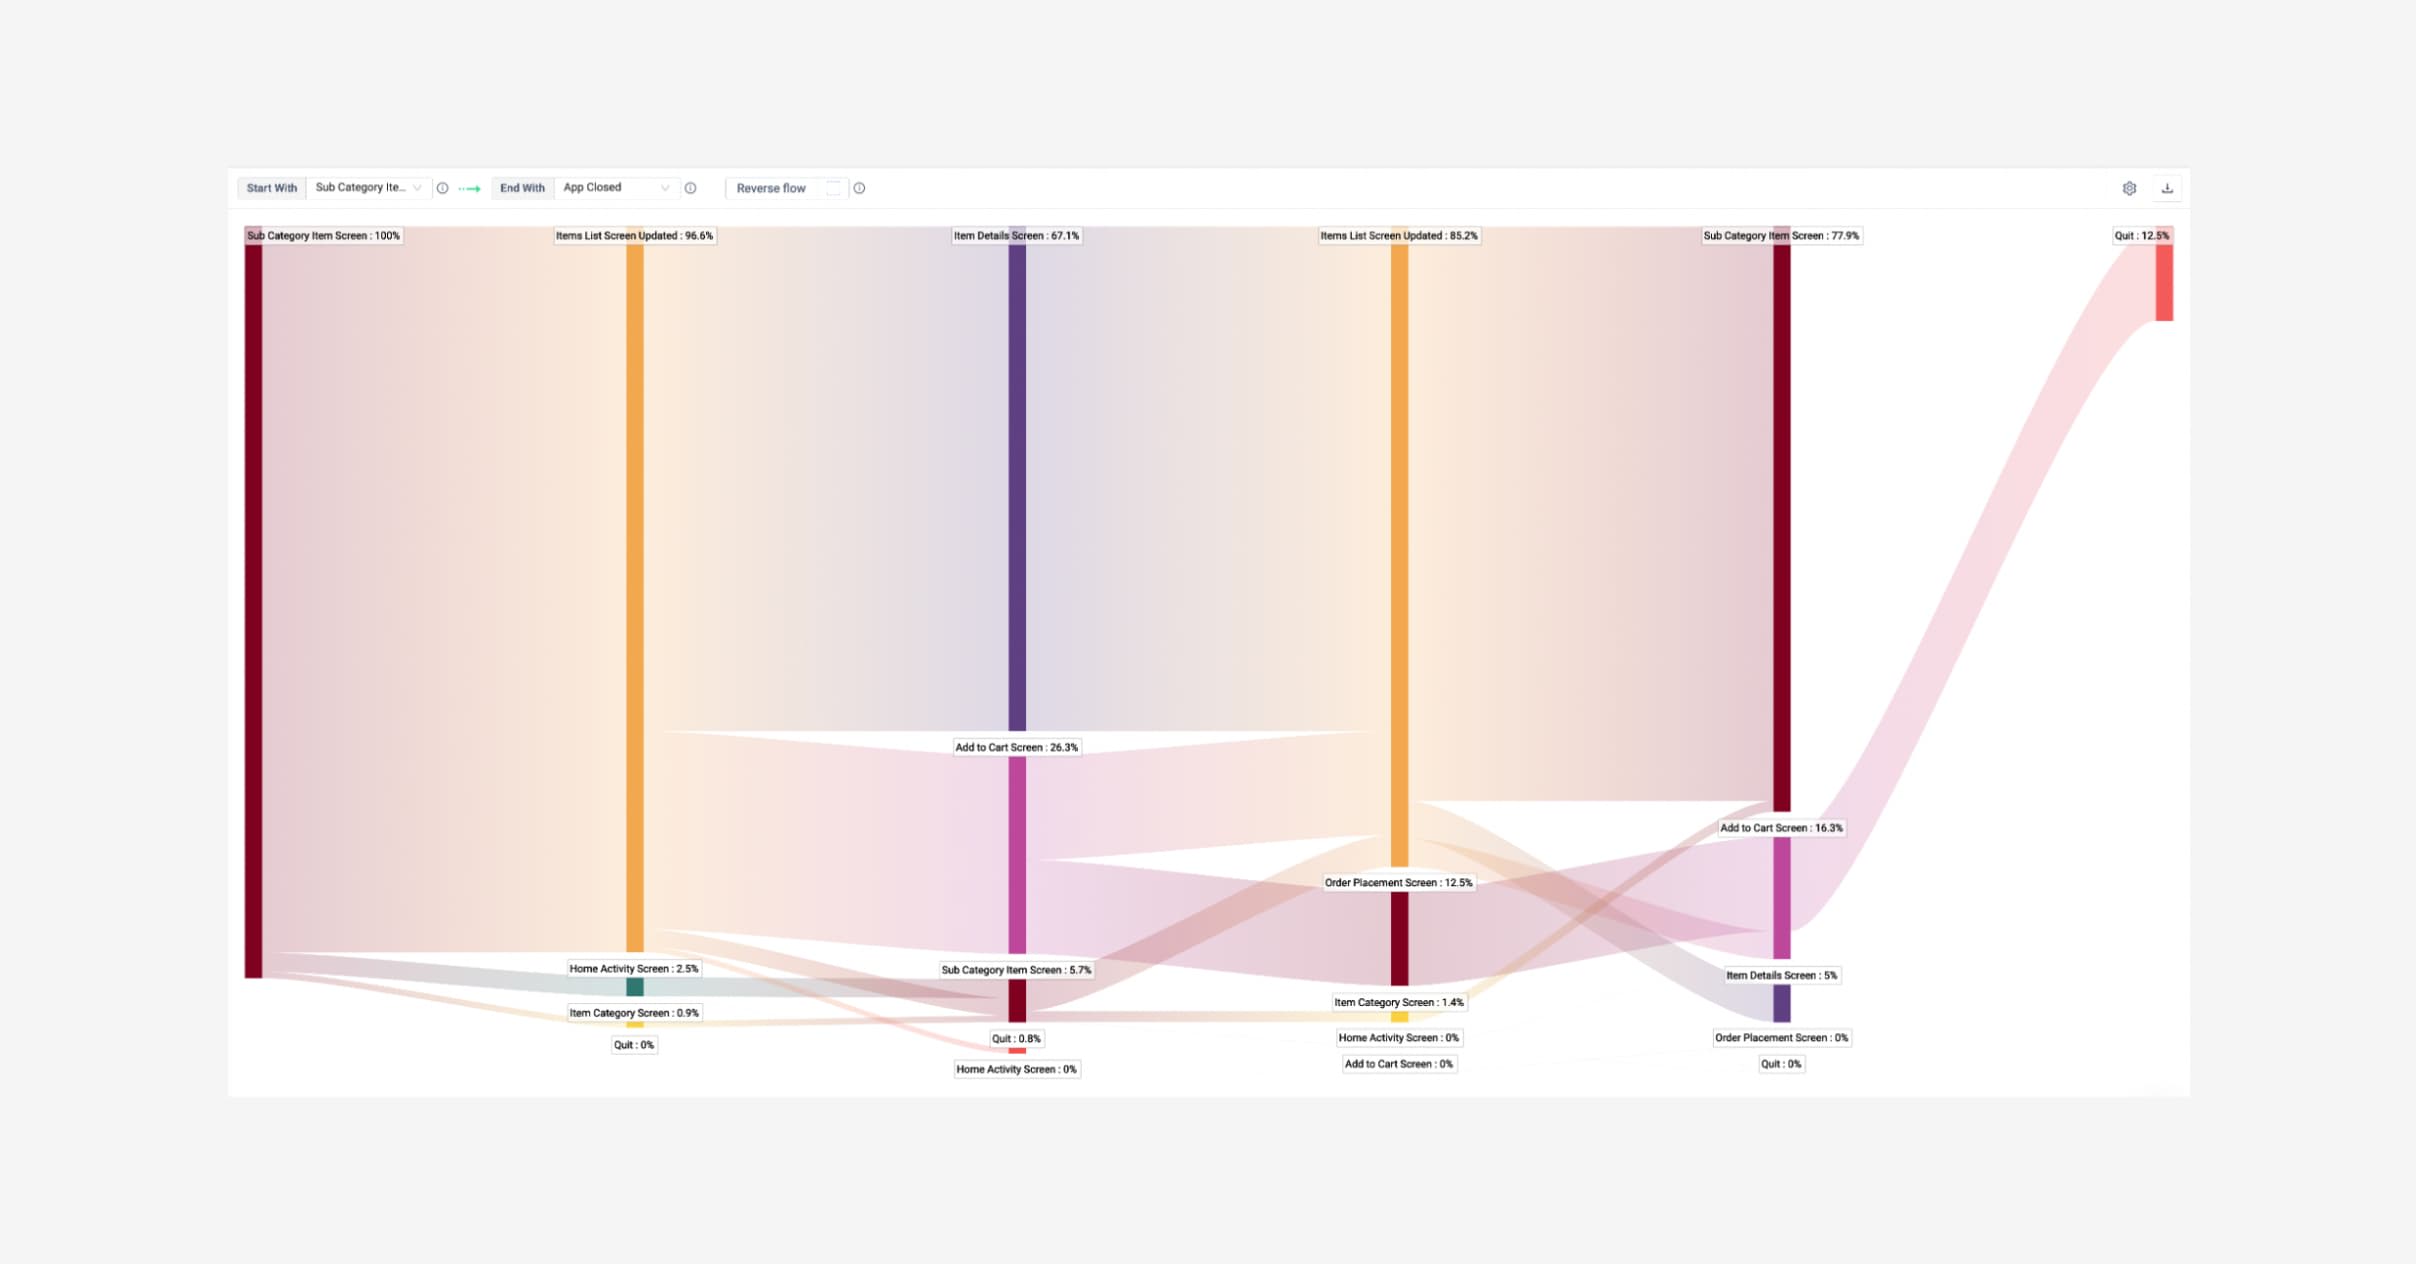
Screen flow on UXCam showing use journeys from the screen SubCategoryActivity (click to enlarge).
On the left menu bar, head over to app navigation to see which screens end with an exit screen. You can track different journeys, set the starting screen and the ending screen - depending on the size of your app you can have multiple journeys to analyze.
2. Look for ‘exit anomalies’, in other words, exit screens that shouldn’t be the last screen in the journey. We see in the graph here that 24% of users quit after going to the ItemDetailsActivity screen. Tip: To identify exit anomalies, click Reverse Flow and you’ll clearly see the screens from which users quit the most.


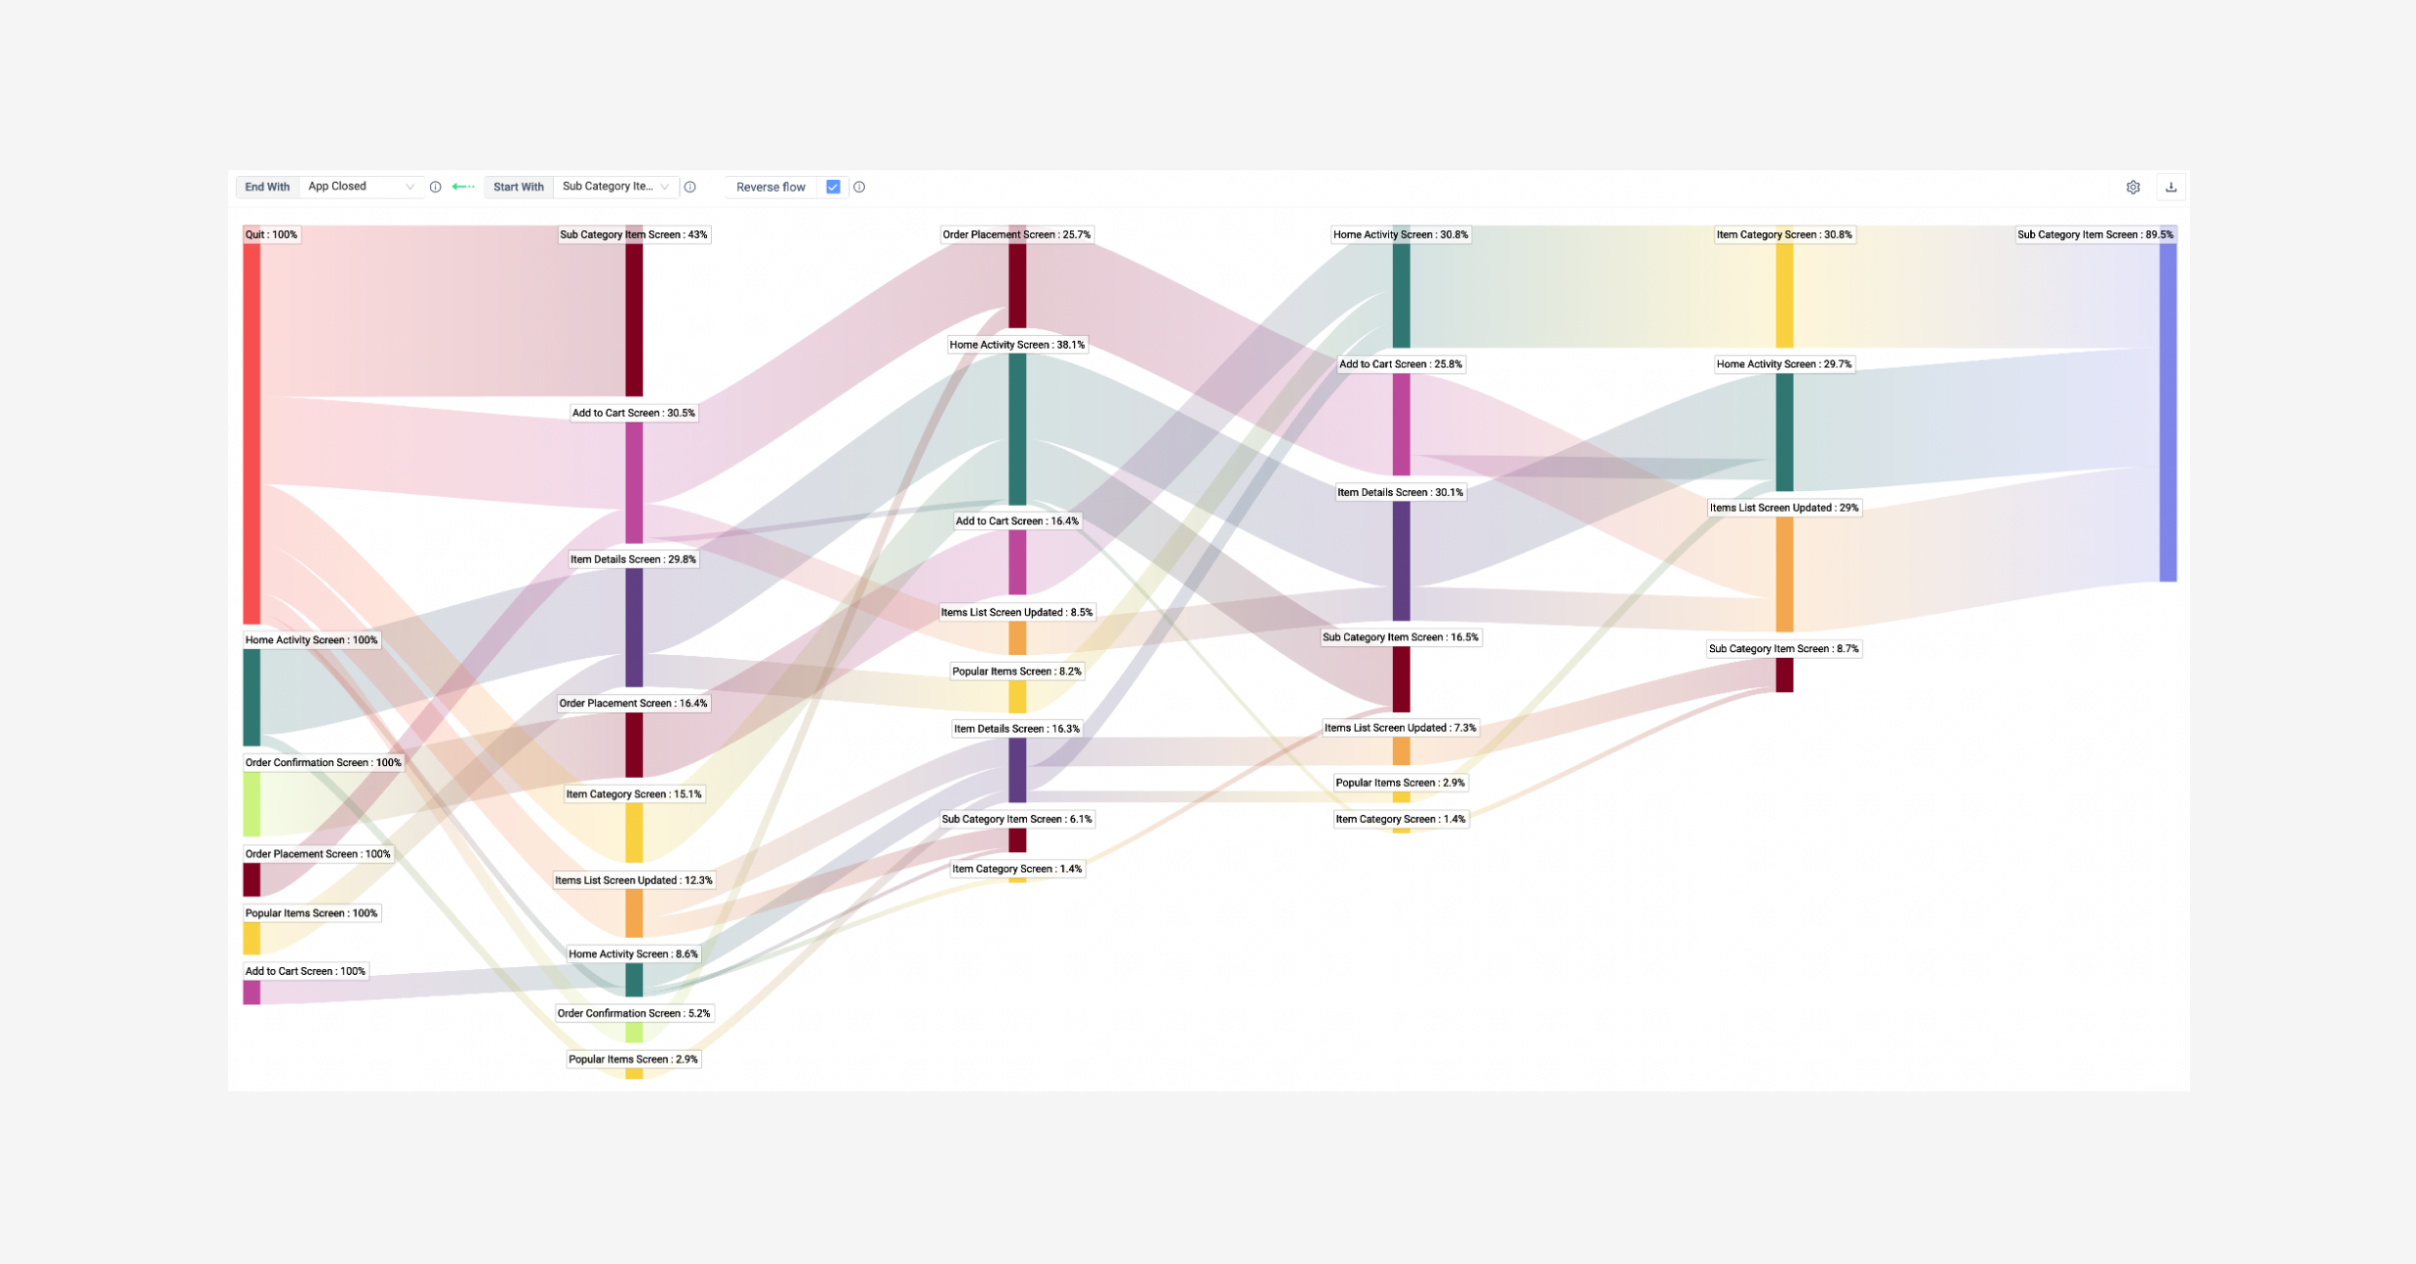
Reverse Screen Flow to identify exit anomalies (click to enlarge).


Identifying problem screens with Screen Flow (click to enlarge).
3. Analyze these problematic screens - Hover over the quit flow and you’ll see the ItemsDetailsActivity screen to get a visual reminder of which page is causing issues. Navigate to “Screens” and search for your screen name there. Here you can see a list of screens including their:
Visit count
Visit duration
User count
Time on screen
Rate tap rate
App quit rate
Crash count


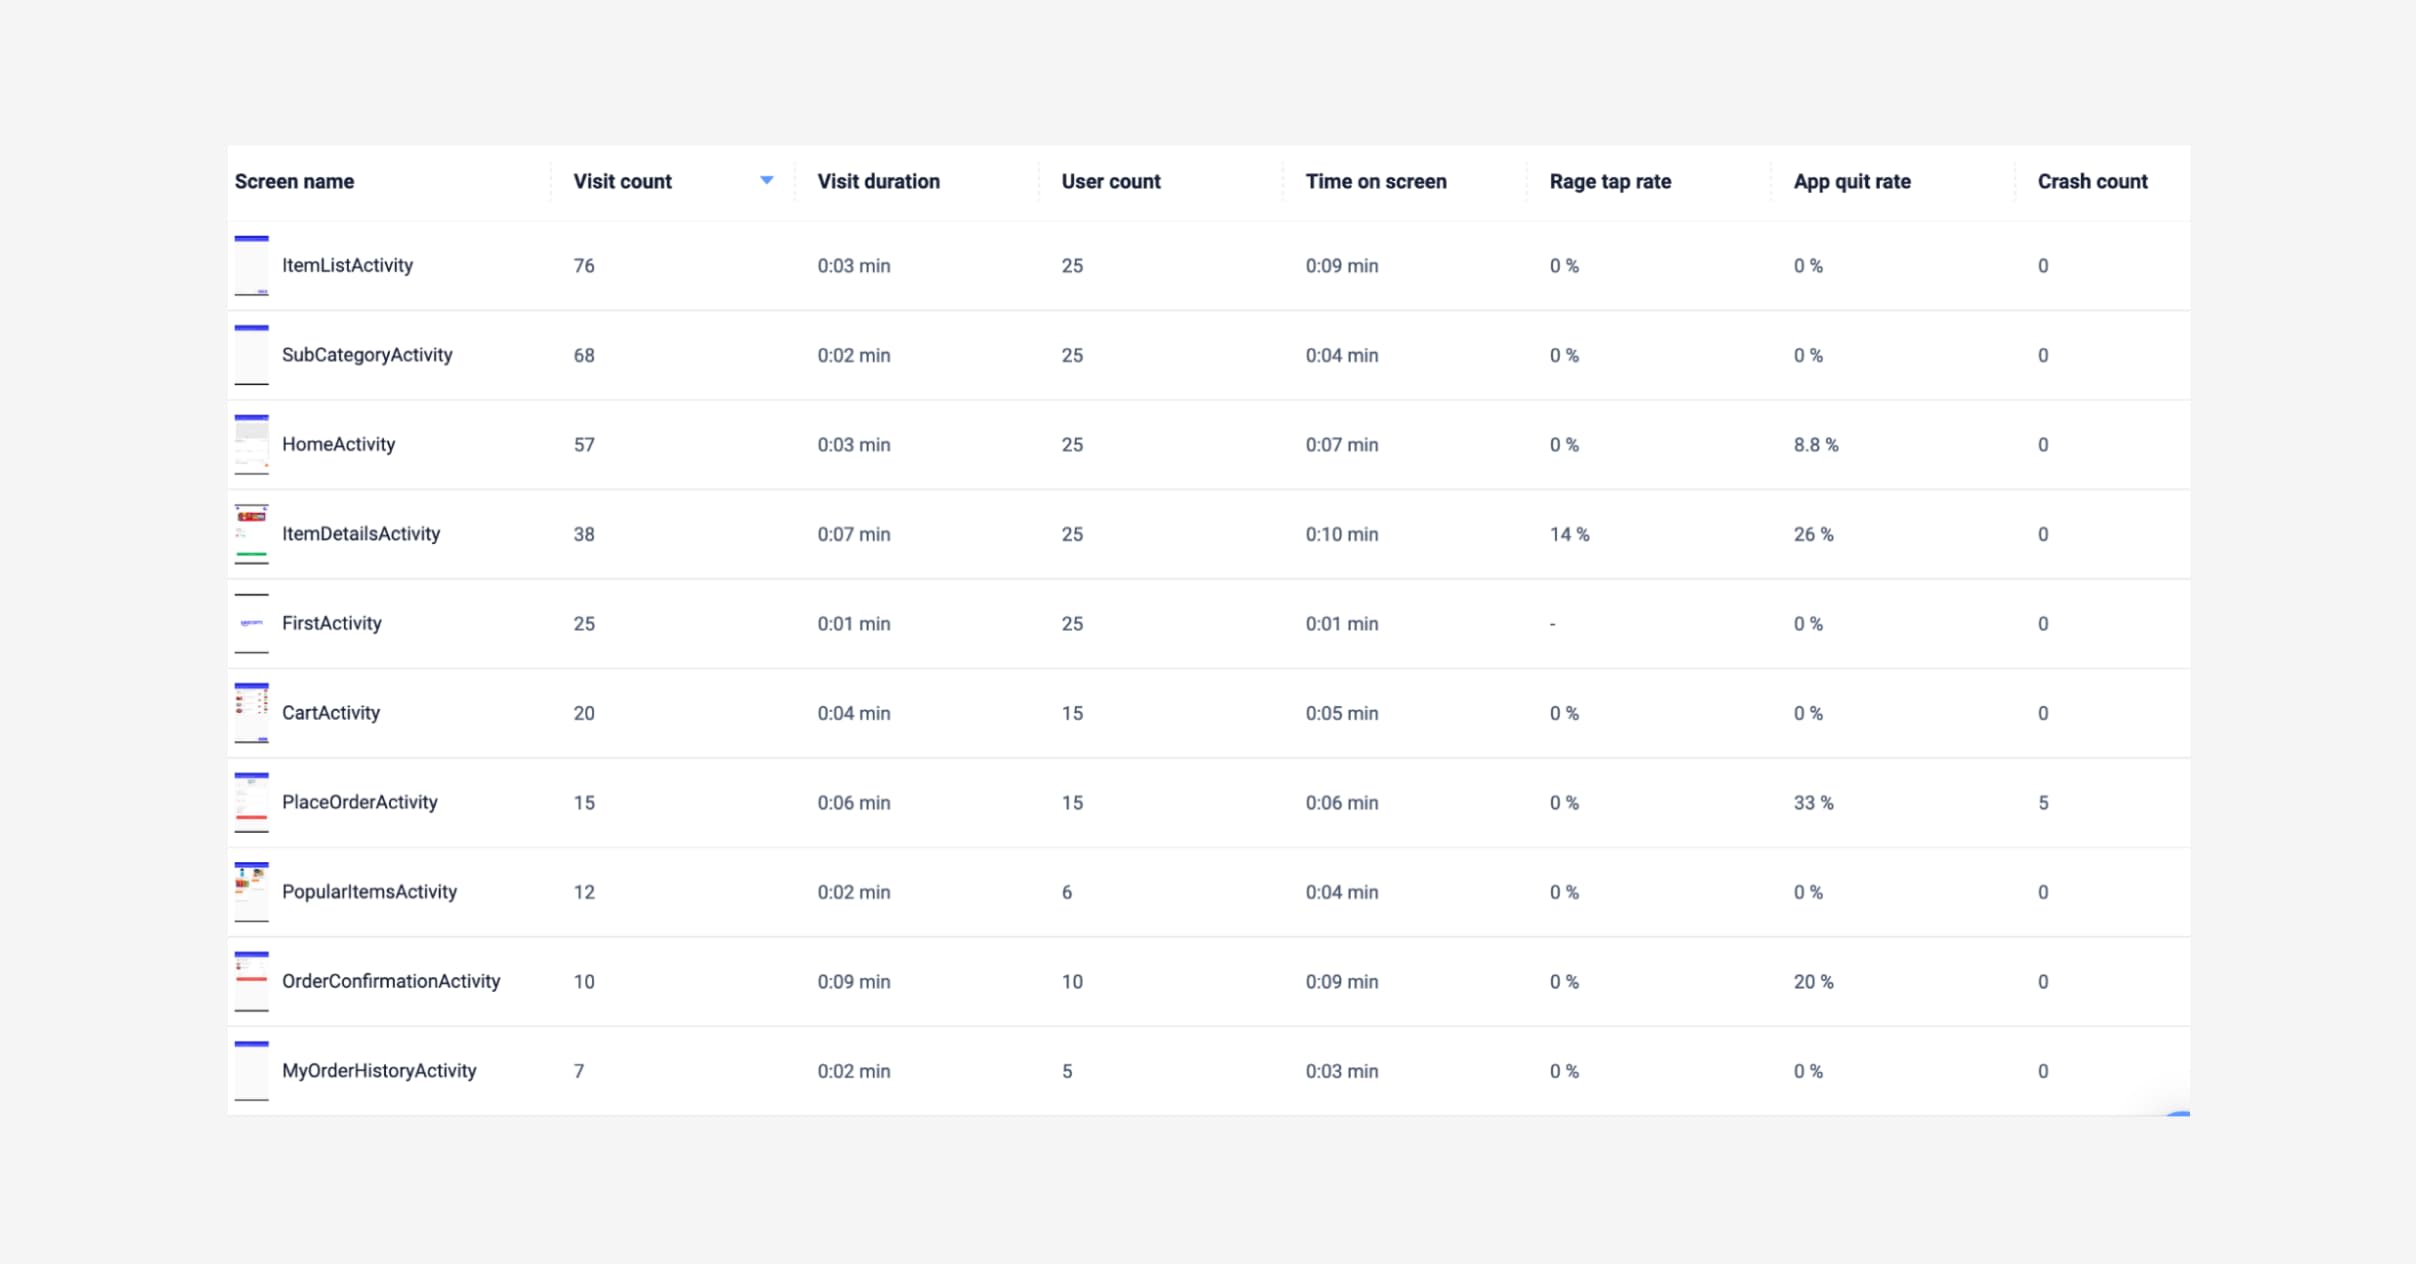
Screen list on UXCam (click to enlarge).
4. Narrow your search down to screens with the highest quit rate: A high quit rate percentage for a page users should be staying on is anything over 50%. Of course, there are exceptions, if the page navigates you to another app then loops you back, that’s considered a ‘quit’ to UXCam but may not be necessarily a bad thing. You can resolve this with allowShortBreakAPI. Here you’ve arrived at our screens which shows you how the user was engaging with the screens before they quit.


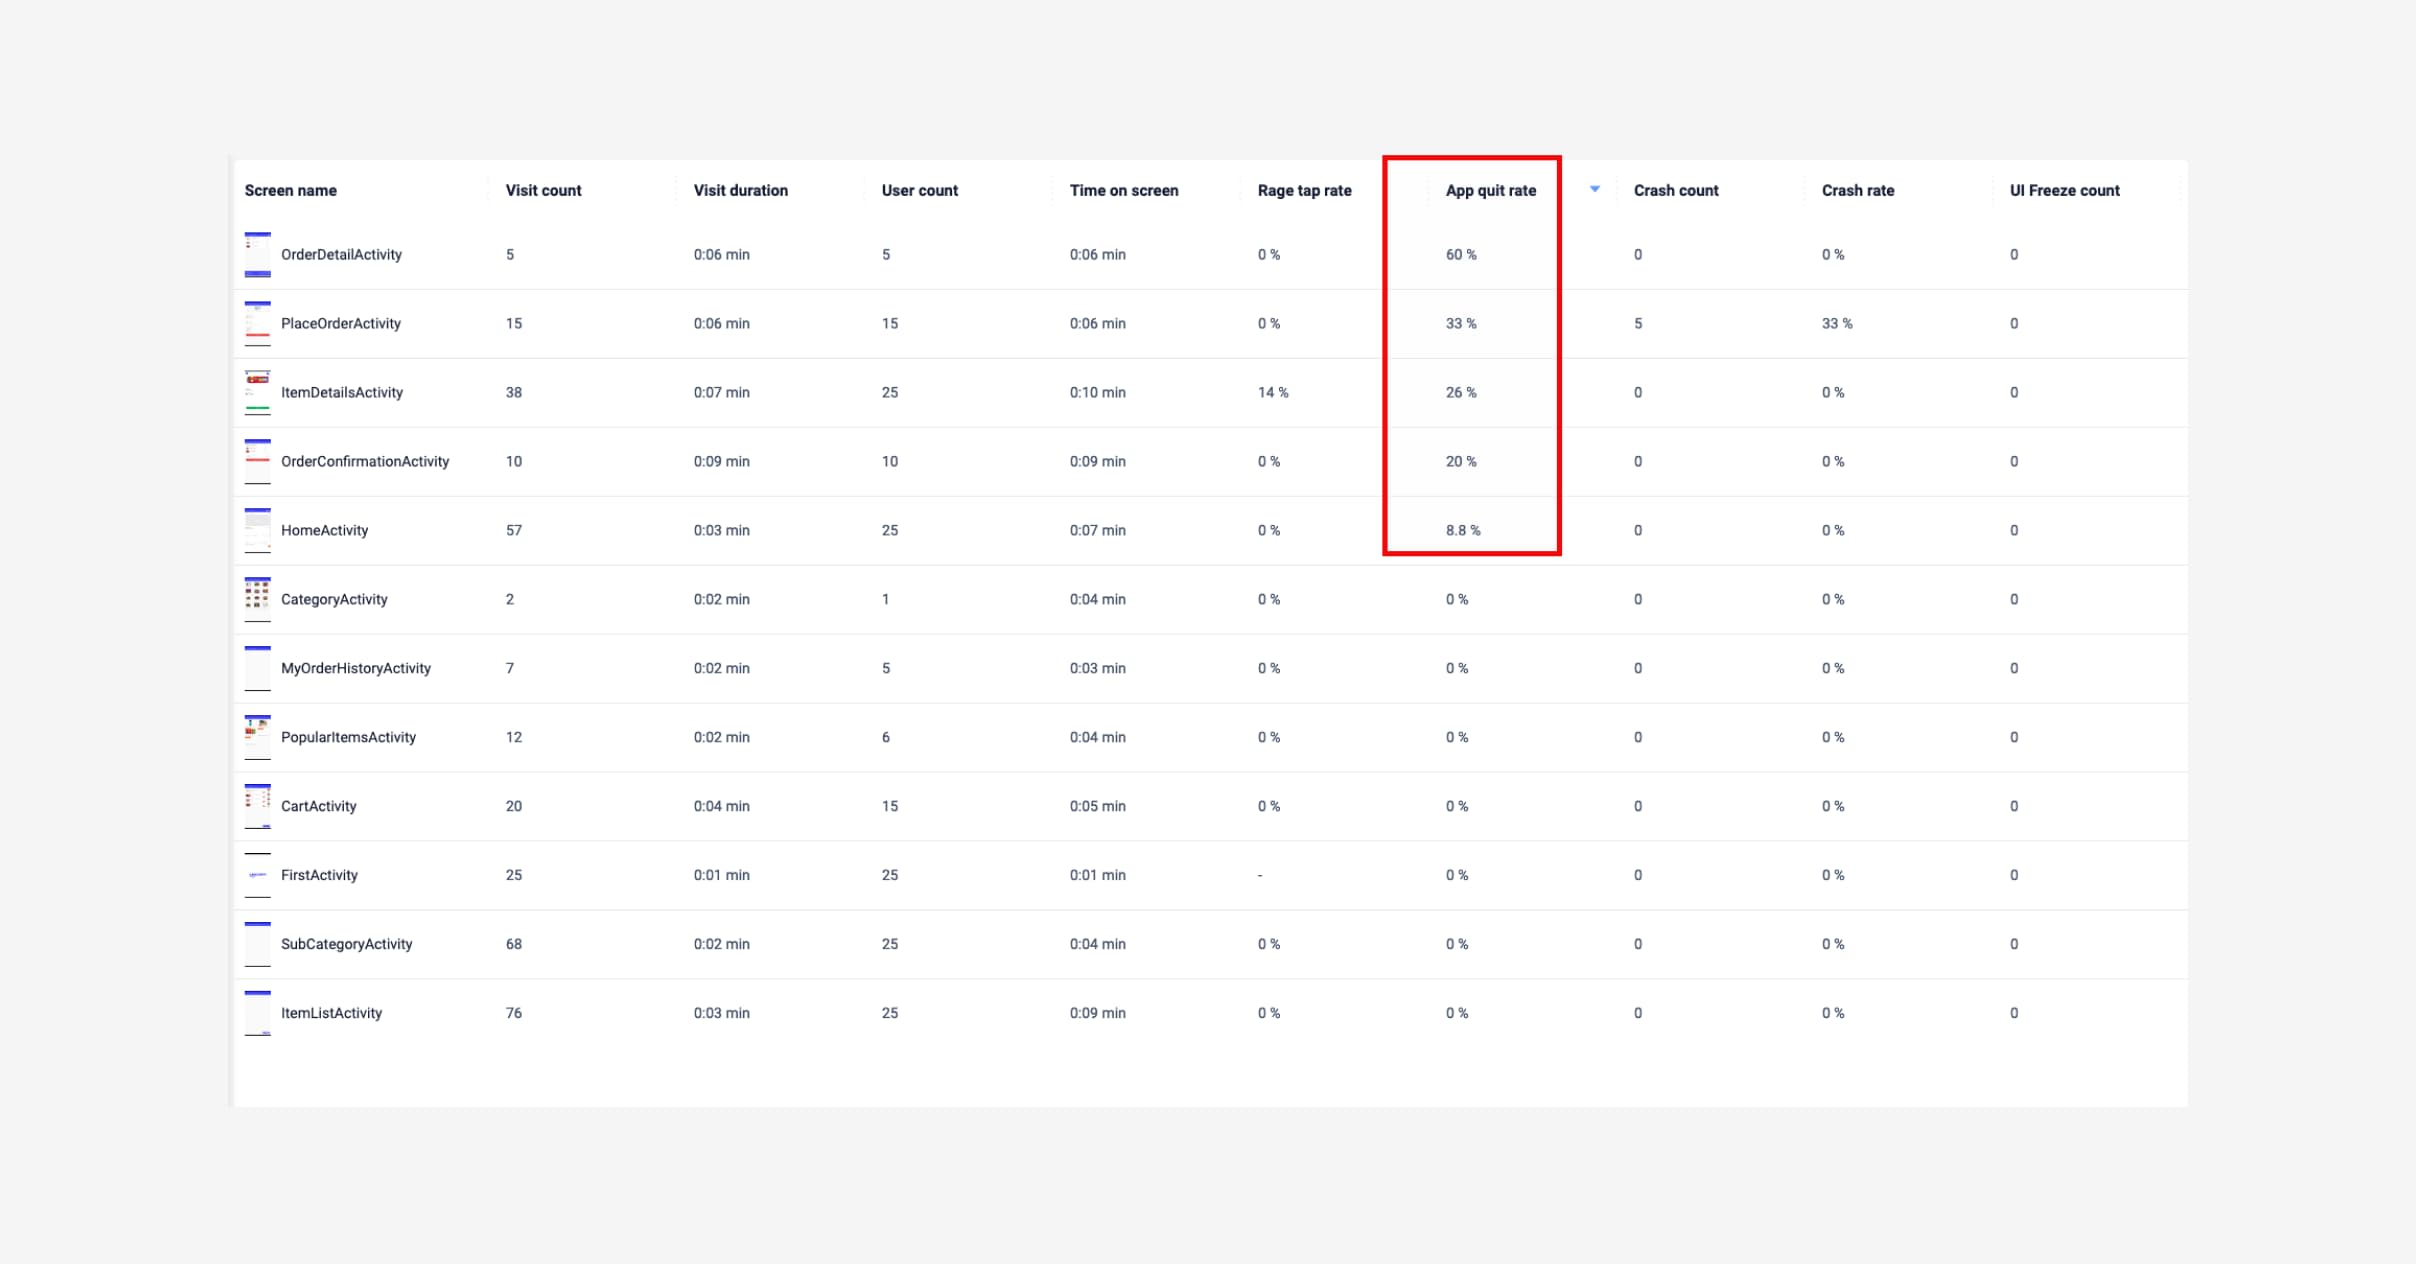
Narrow down your search and look at quit rates (click to enlarge).
5. Check for technical issues: From the screens page, do a quick check for Rage rate, and crash rate. If these numbers are 0, you can hypothesize that people are quitting this page based on a UX issue, handled exceptions, and non a technical issue since crashes are low.
6. Analyze the heatmap: Look for 3 main things
Click into the screen with the high quit rate percentage. Watch the heatmaps and keep an eye out for:
Confusing UI
Broken UI elements
Readability and content alignment


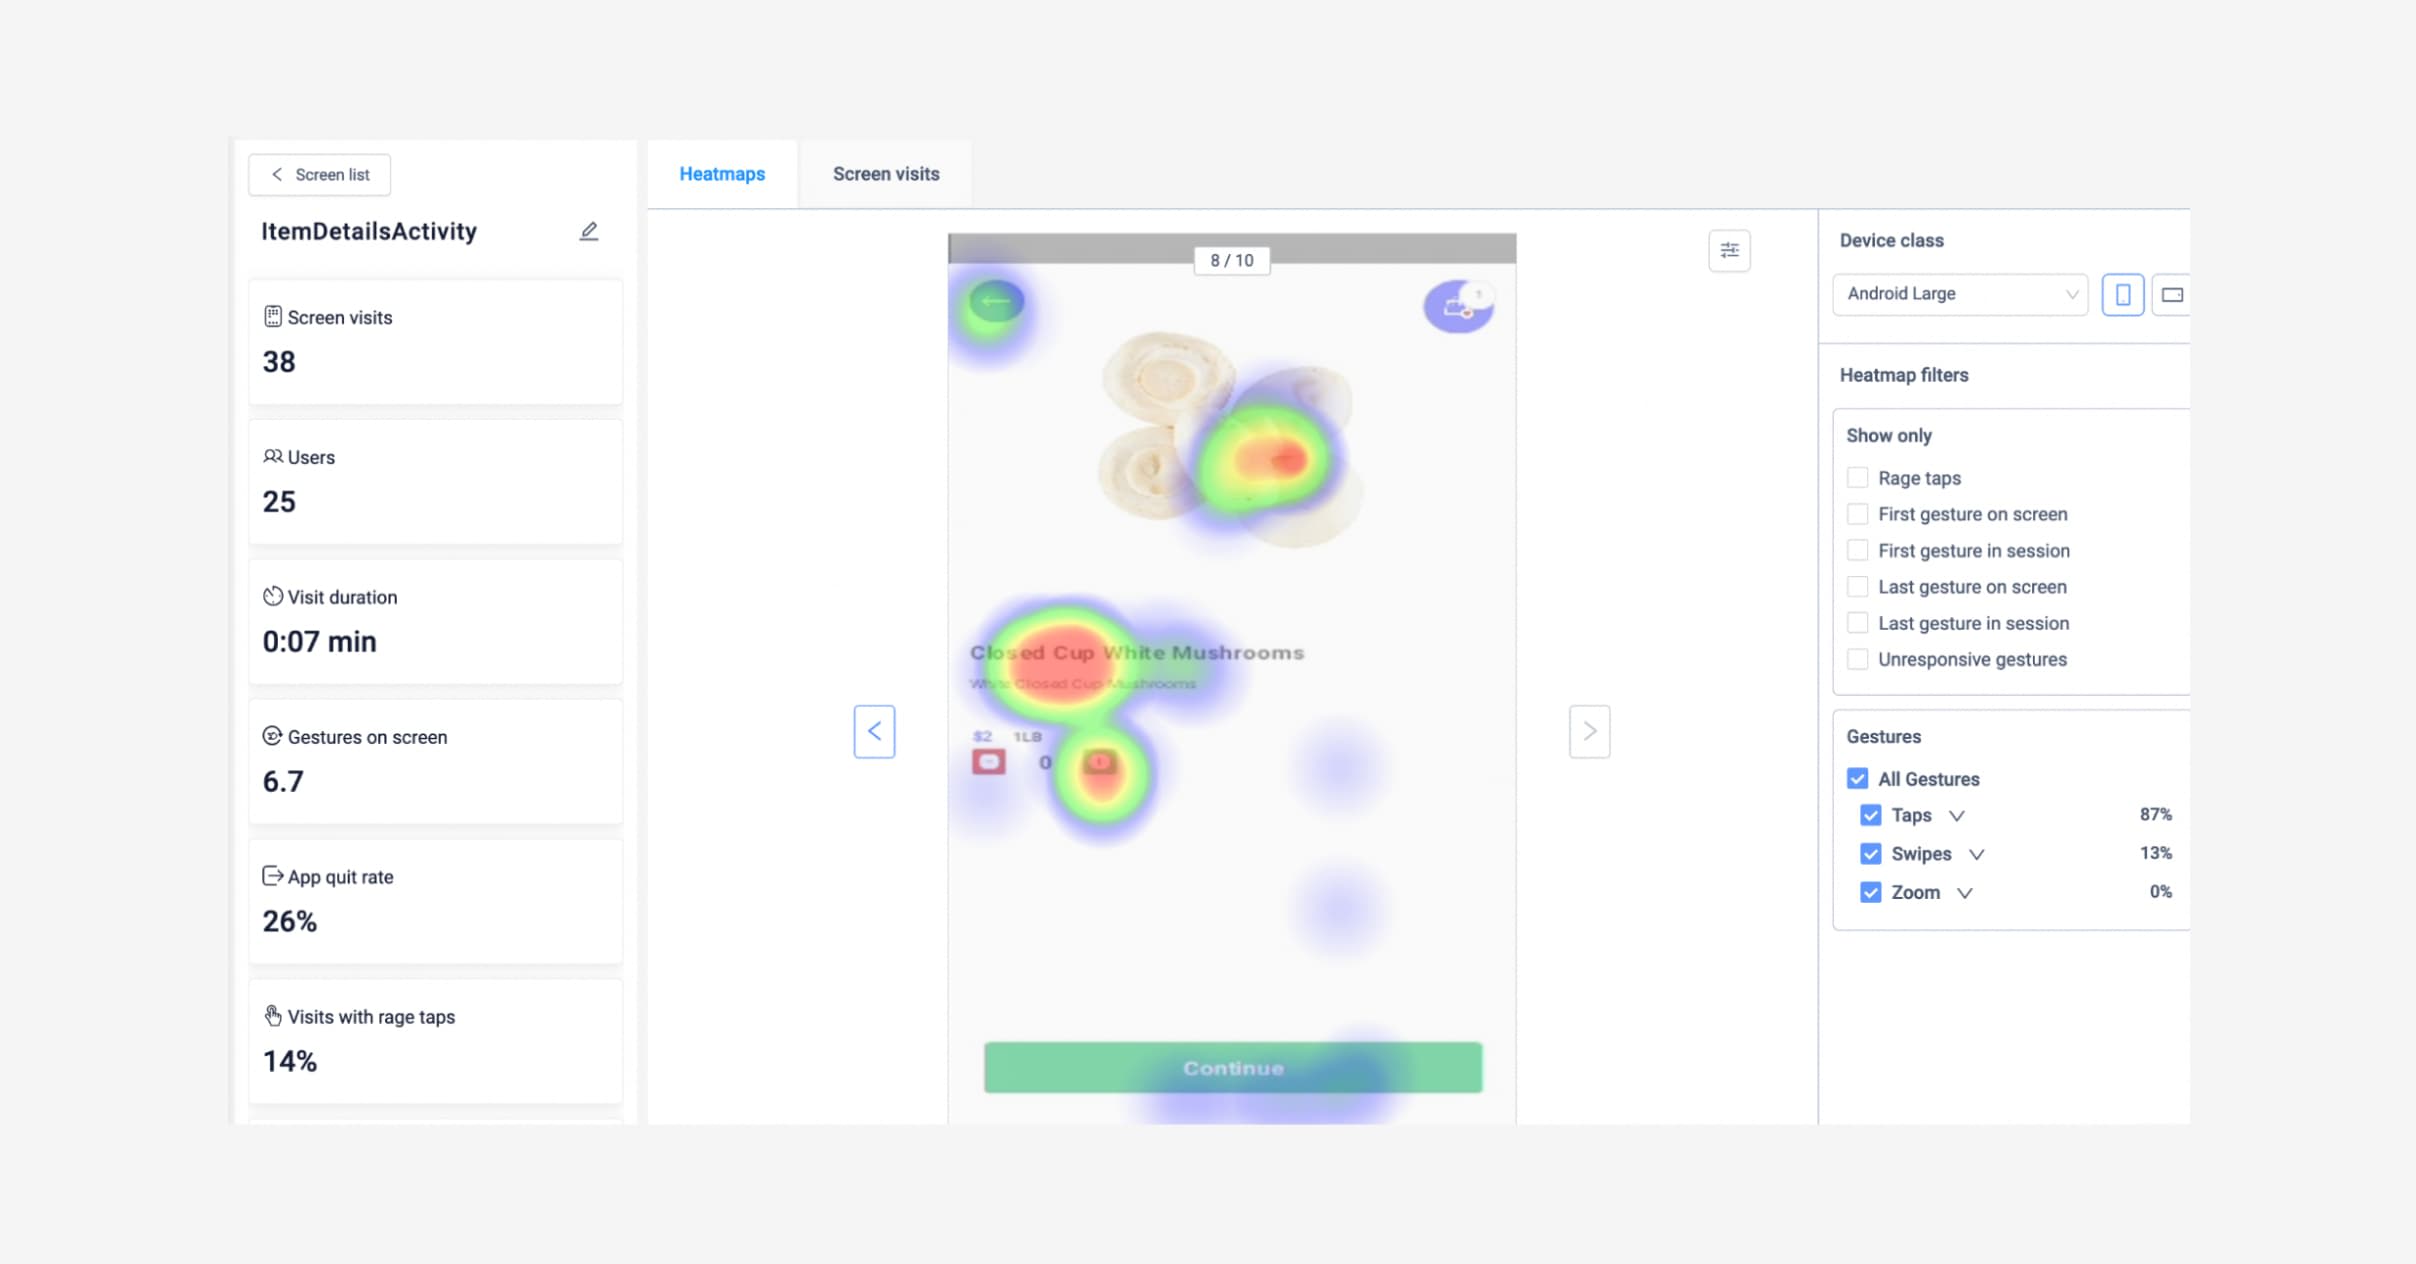
Heatmaps on UXCam showing rage taps (click to enlarge)..
In this heat map it looks like something’s going on with the product title. You can filter your gestures in the “Show only” panel to further investigate. Filter by:
Rage taps
First gestures on screen
First gesture on sessions
Last feature on screen
Last gesture in session
Unresponsive gestures
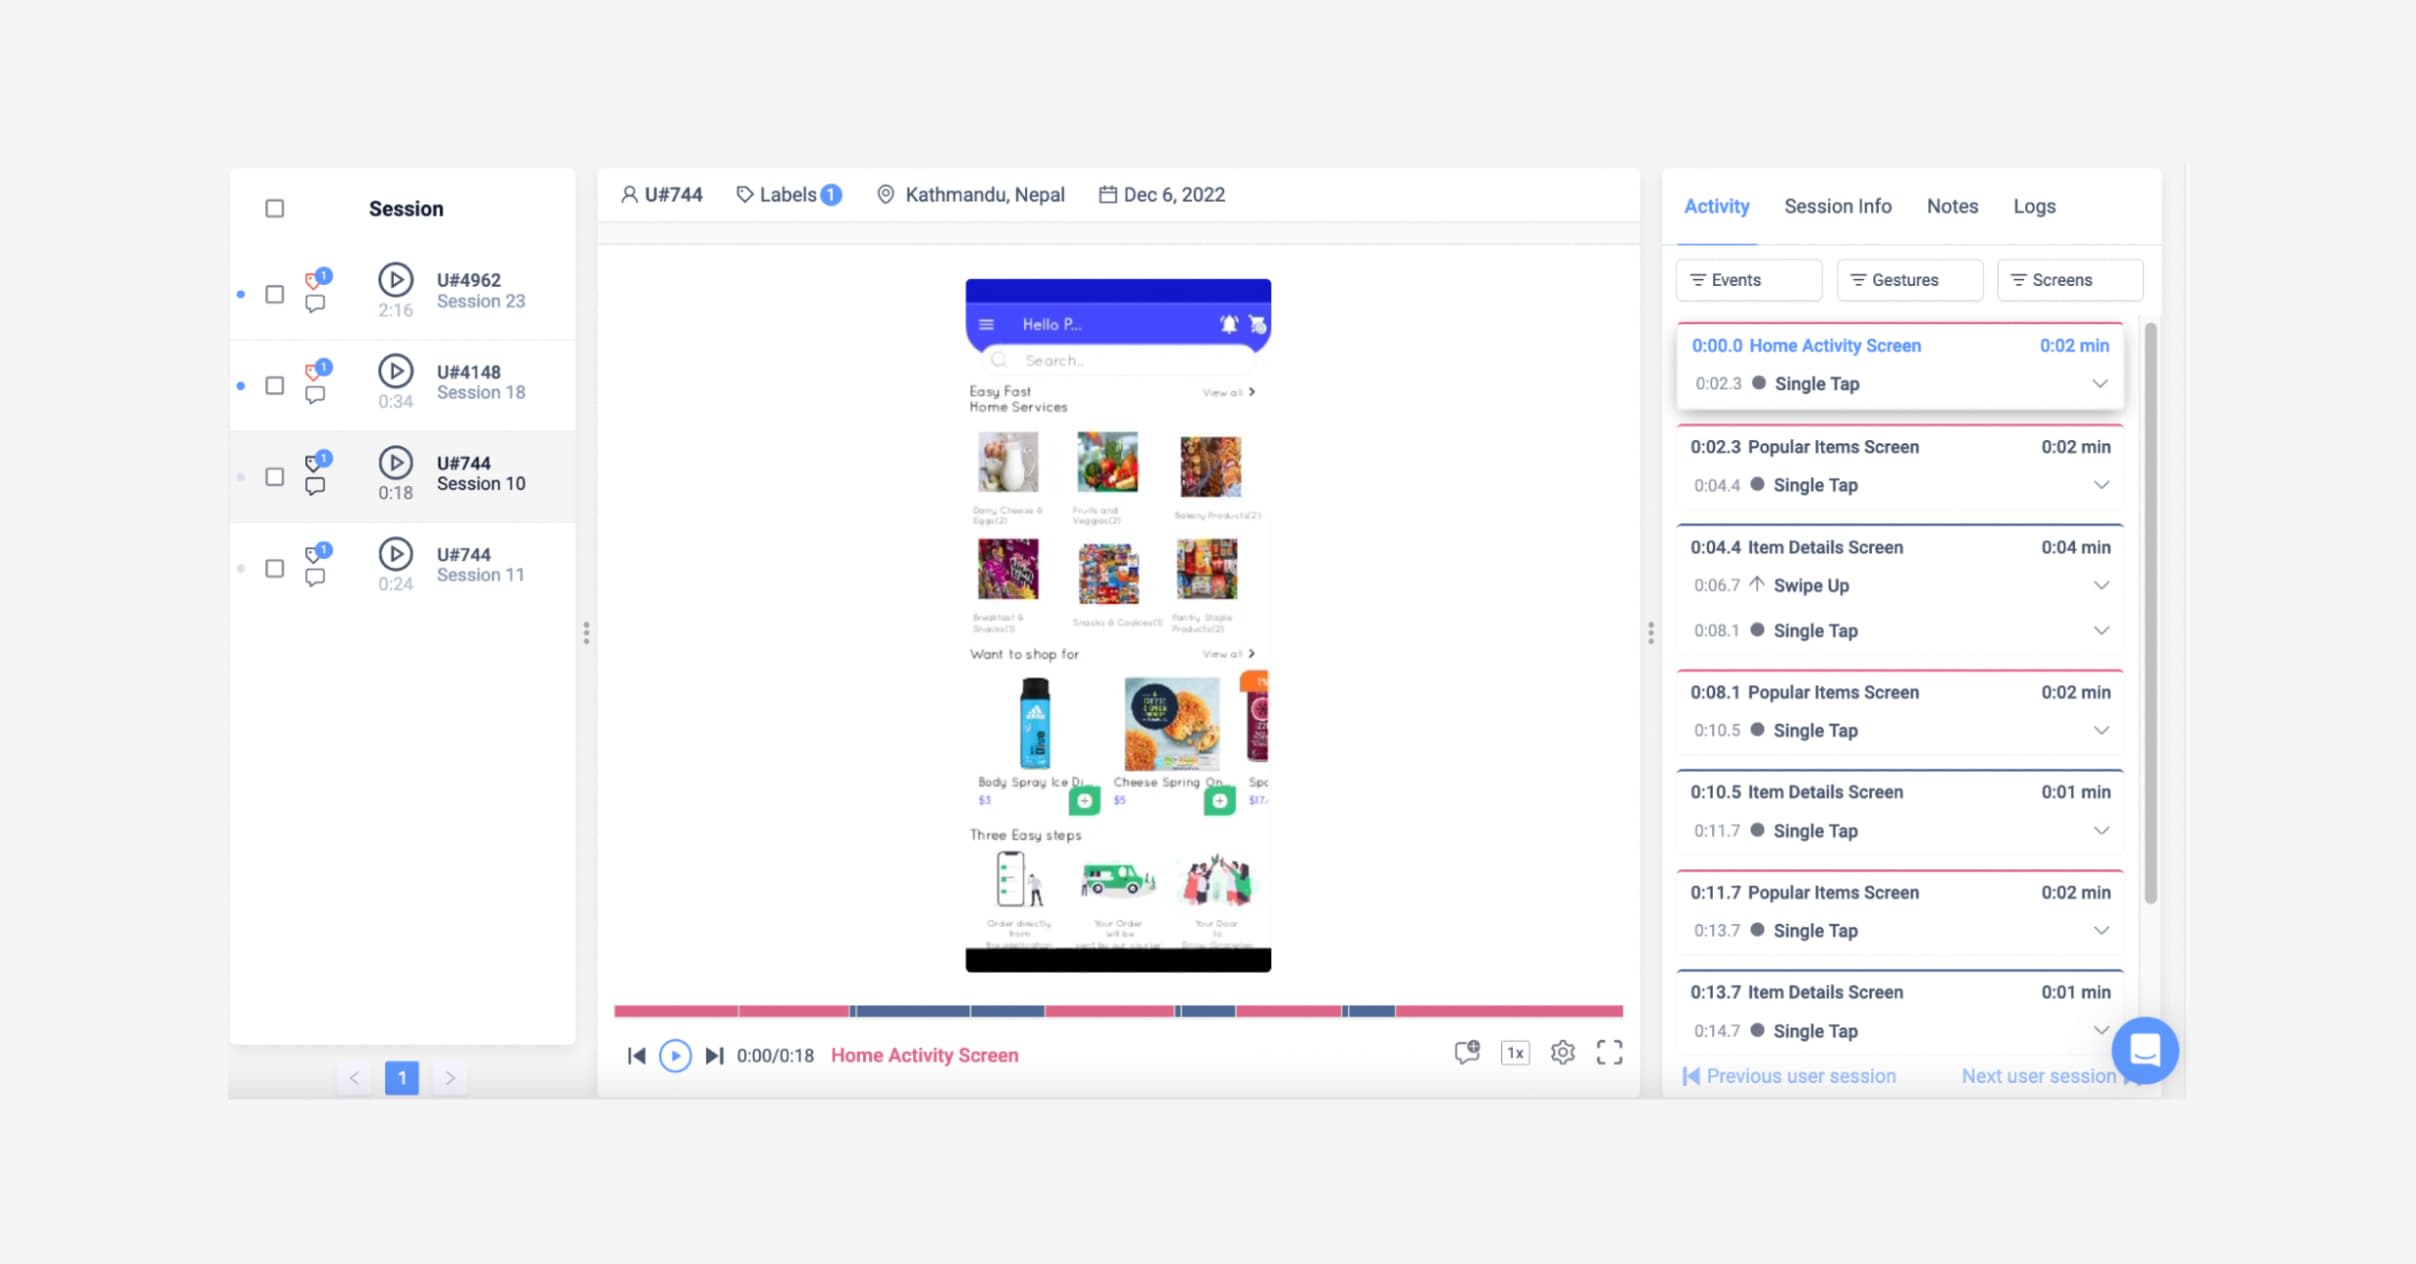
Once you’ve narrowed down your confusing issues, navigate to session replays and search for your screen. From the session replays, watch a video and dig into the full context of what action or feature caused the user to quit the screen.
Hot tip: Switch over to the “Screen visits” tab in UXCam to watch how real users interact with the screen. Filter on what you are looking for to get deeper insights such as
app version
sessions with rage taps
sessions with unresponsive gestures
short sessions
long sessions
sessions on a specific device
7. Set up dashboards for tracking retention based on findings from heatmaps and session replays: From the session replay you can probably get a good idea of what’s working and not in your app.
If there’s an issue with the feature, you can get even more granular by sending over custom events to UXCam and creating reports specifically around that feature.
Let’s say, the hypothesis is - the ‘add delivery’ checkbox is causing unresponsiveness and rage taps on the screen, and therefore, users are abandoning their purchases.
You’ll want to keep an eye on that ‘add delivery’ button, so you can set up a custom event for it and track how often it’s used over time — you can graph by hour, day, week month.
To get even more in depth, you can send over event properties to gain further insights about the users behavior. Properties are additional information to the events. For instance in the case of 'adding delivery, property could be the delivery method such as ‘pick up vs. delivery’.
If you need a little help with event ideas for your own hypothesis to get started, we’ve created an event idea guide. Yes it requires manual tracking, but this added flexibility means you can combine granularity with the big picture.
Now it’s time to set up a widget to track the ‘add delivery’ event, the count, and how often it’s used per day.
The cool thing about customizable dashboards, is you can see a preview while you’re setting up the dashboard:


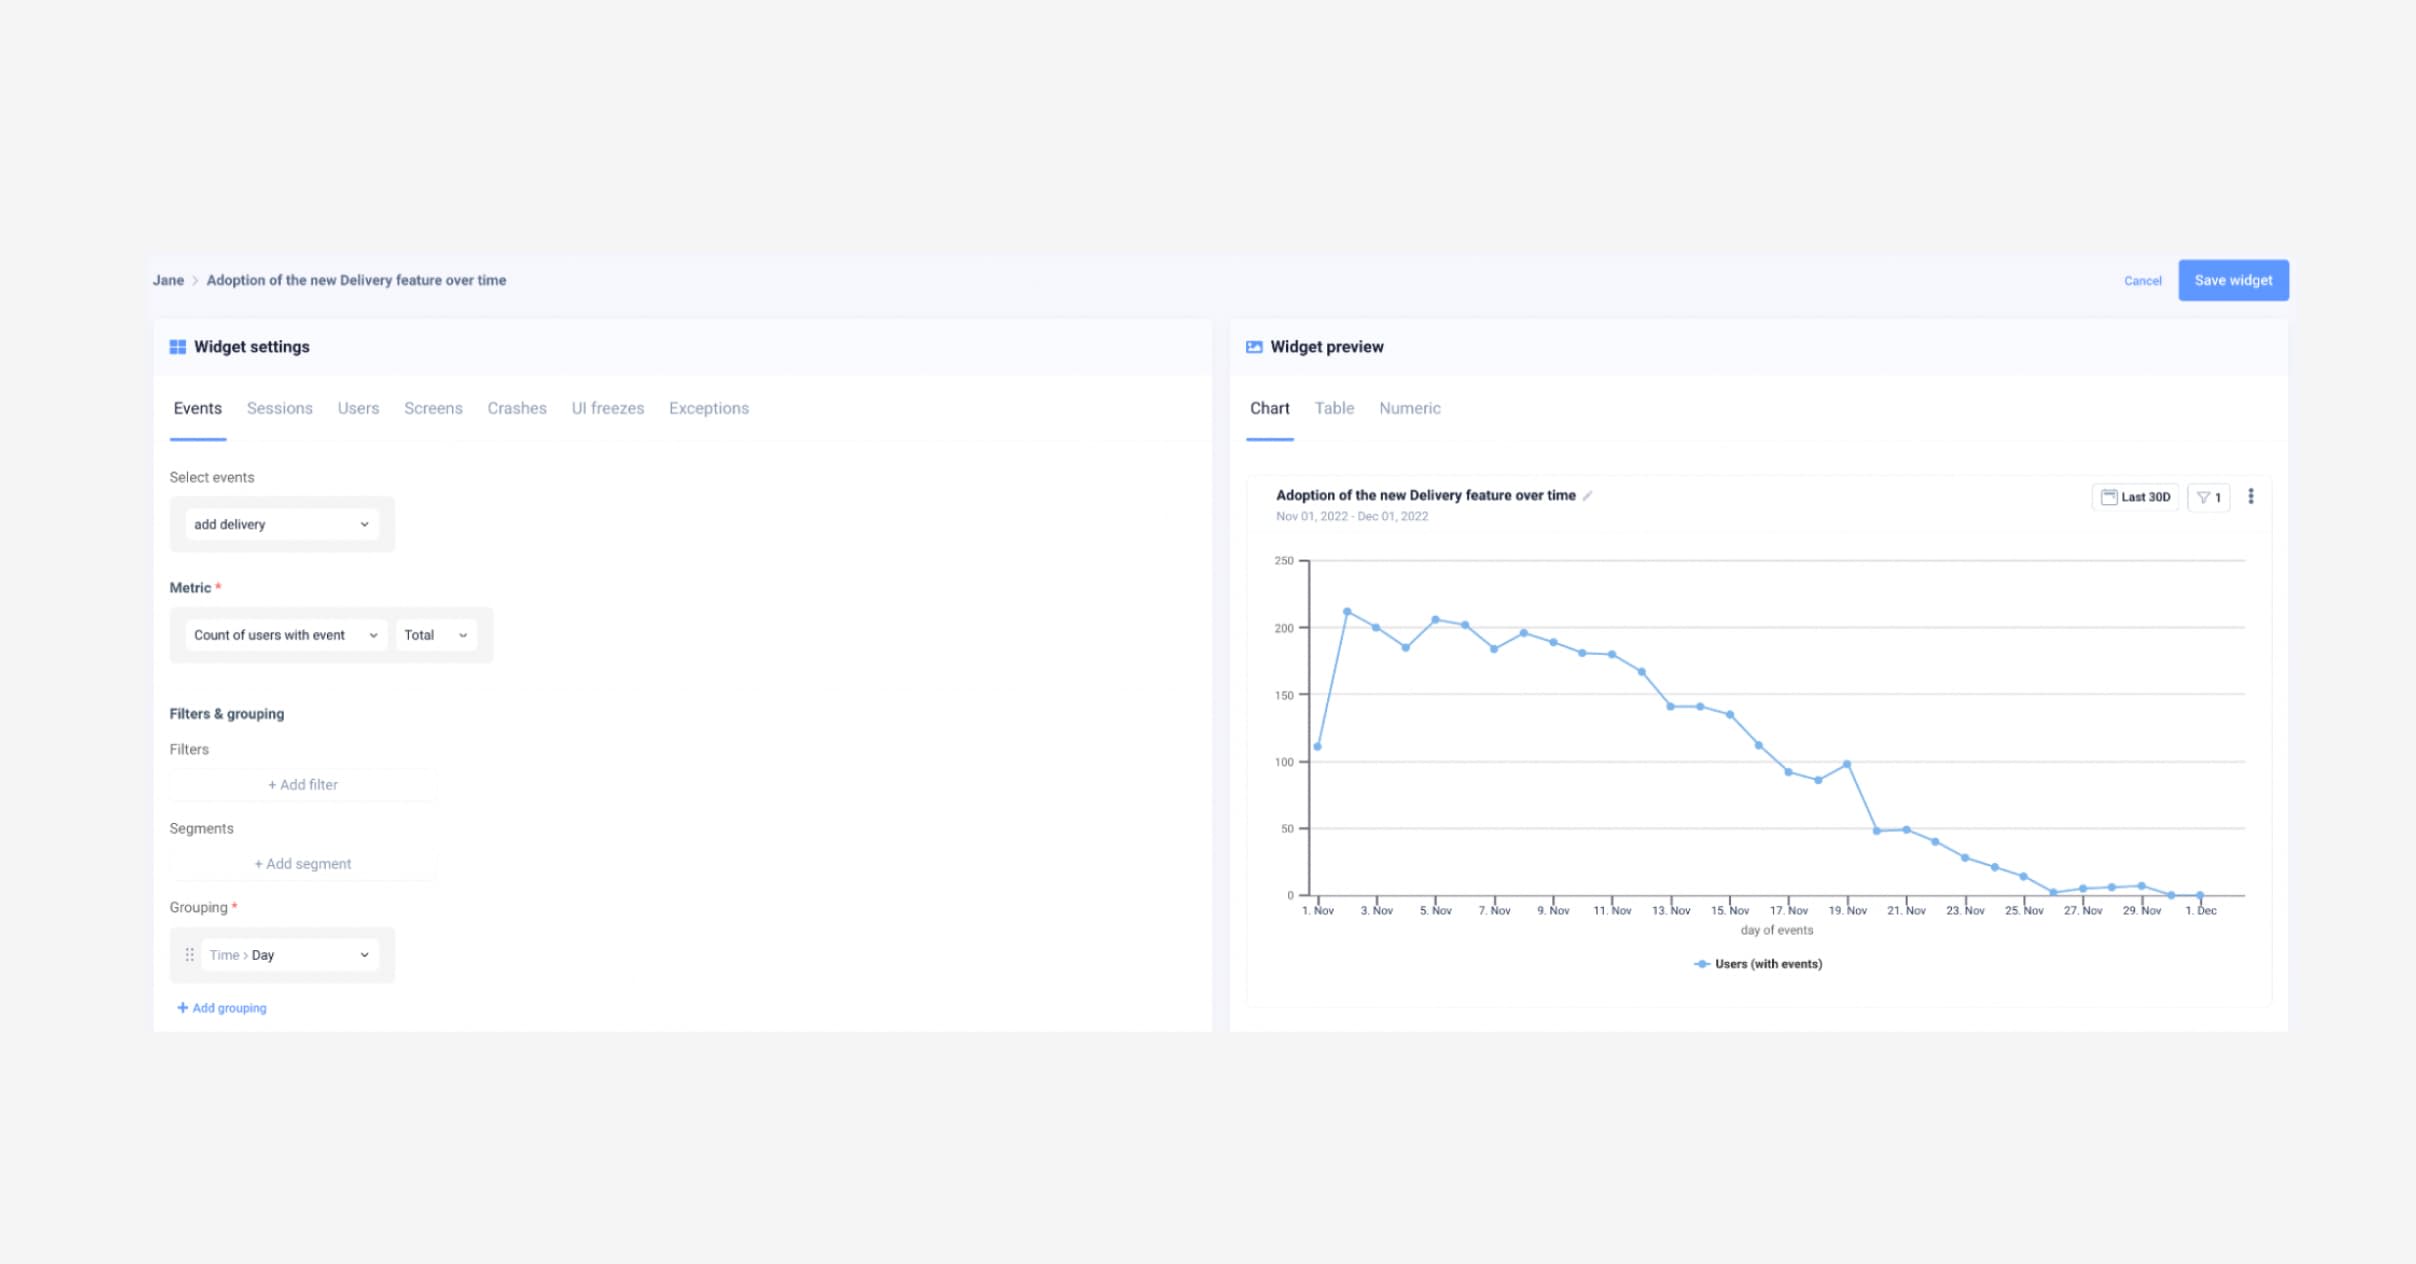
UXCam dashboard: A combination of custom events and auto captured data gives you the micro and macro picture of your feature usage (click to enlarge)..
Here are a few more dashboard examples you can copy. If you need some ideas on potential retention killers to explore, here are some examples:
Authentication issues
New versions to adopted
Old device types with weaker hardware or connection issues
External payment provider issues
Mistimed marketing offers on screen
Biased user research findings from beta testing
For a closer look, you can watch a video of how to use UXCam for retention here:
Challenge #3: Shorten feedback loops to customer success
Now you’ve found the problem, how do you resolve it effectively and efficiently? The path from problem to solution will always require other members of your team. Customer success, engineering, UX, or design. Shortening this critical path will be a key to retention.
Solution:
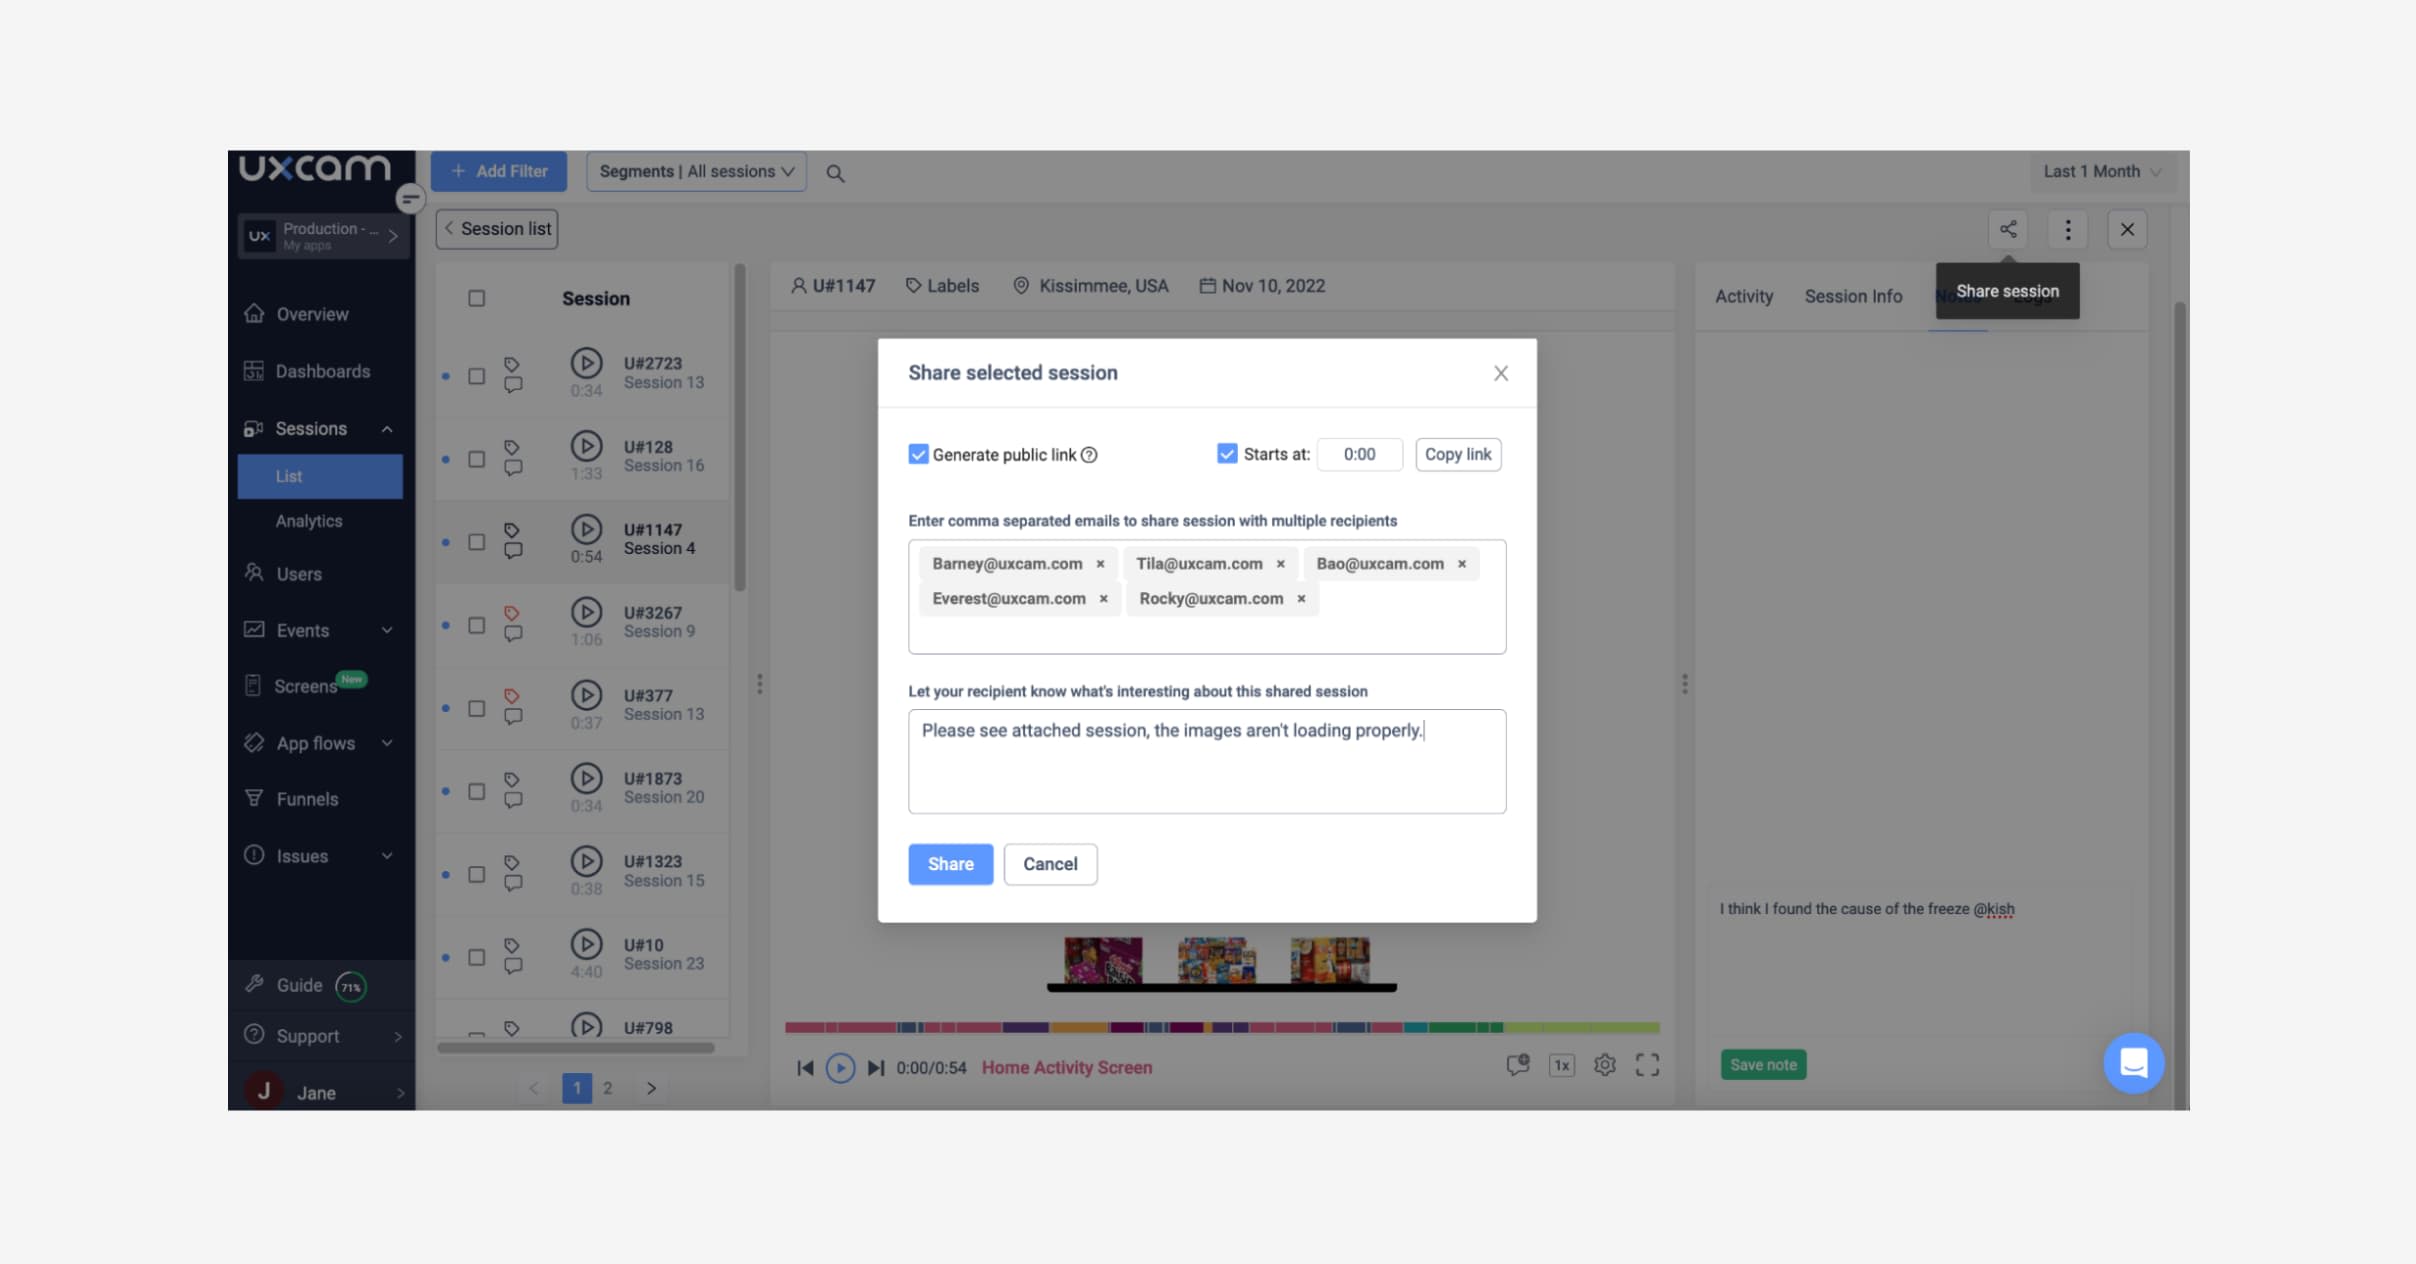
Integrate UXCam with all the tools your team works with.
If UXCam is integrated with your CRM like Salesforce, Intercom, Zendesk, you can link your user sessions with support tickets.
Specialists on the CX side will be able to easily navigate to the session linked to the support ticket. You can also review the technical app logs — which are all auto captured by the way.


Check out the technical app logs on the right panel, all autocaptured (click to enlarge).
Once your CX team has opened up the session, they can see everything that happened. They’ll get the full technical logs such as:
Debug
Error
Fault
Undefined
Warning
Integrate UXCam into your engineer’s existing workflow
To give engineers the full context of the crashes and issues, we have a Firebase / Crashlytics integration. The integration will enable engineers to directly navigate to the problem screens on UXCam. They’ll be able to watch session replays and easily replicate issues as well as all the detailed logs they’ll need for debugging.
Engineers will be able to review the detailed logs behind:
Bug crashes
UI freezes
Handled exceptions
With our Slack notification, you can use UXCam as your main tool for issue analytics and get alerts on Slack for crashes and Application Not Responding (ANRs).
By bringing all teams onto UXCam, you’ll resolve the big bottlenecks of optimizing your app across the entire team. UXCam was built for teams to work together, aligningaround the needs of the user. Collaborate with your organization:


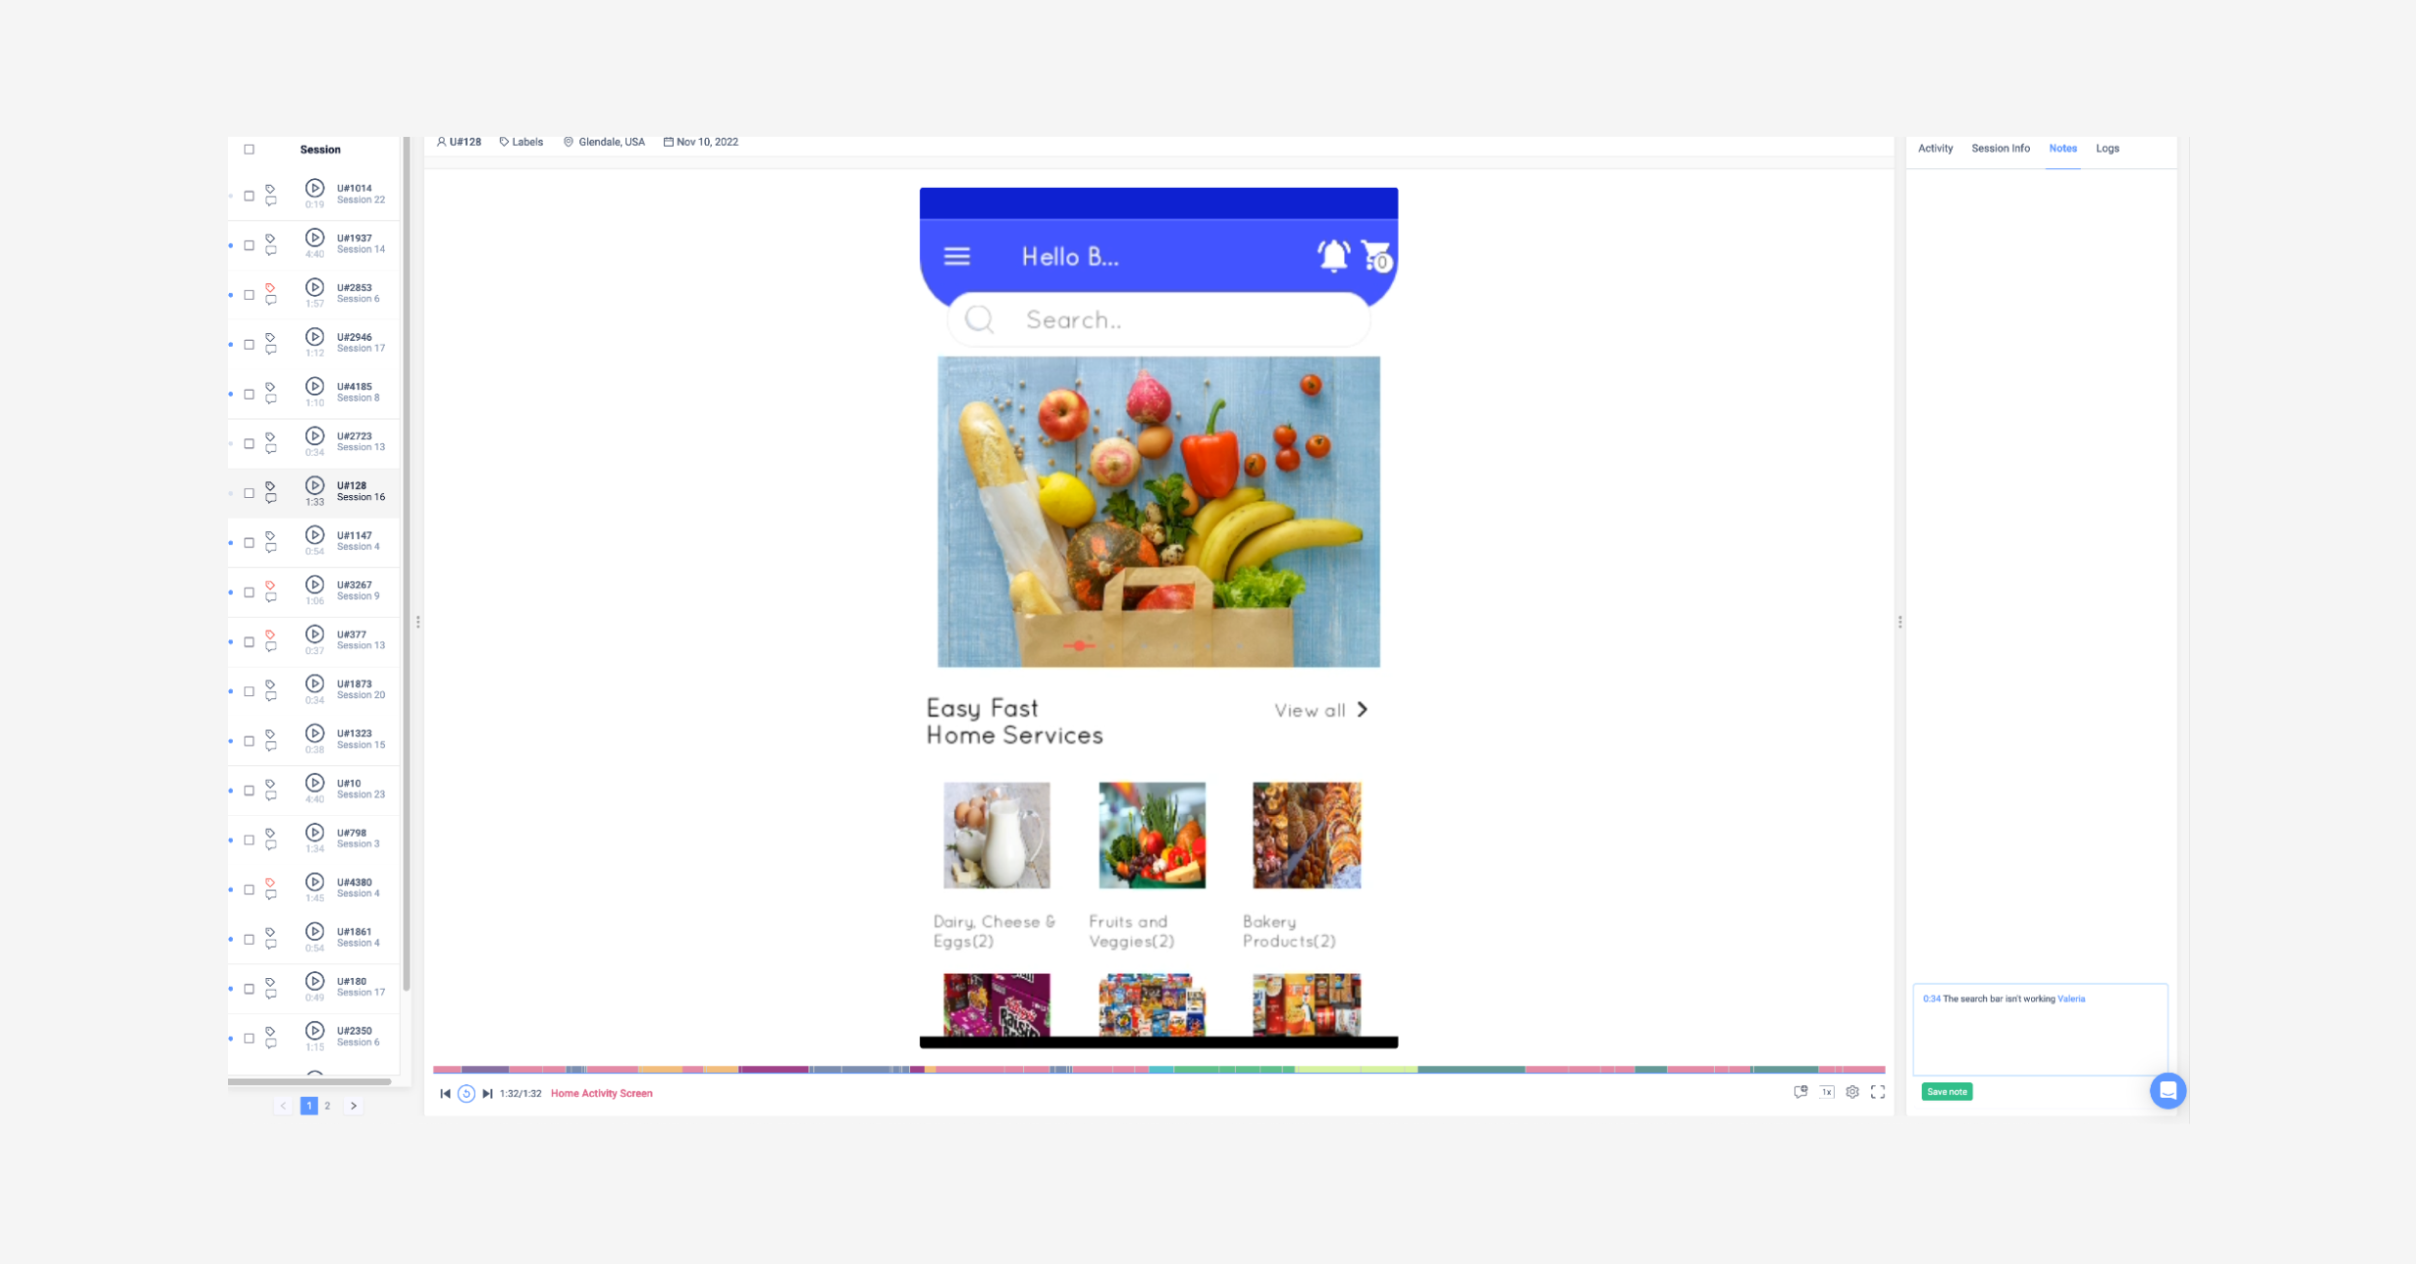
UXCam's session replay.
2. Notes and commenting. Write your notes and save them.


UXCam's session replay.
3. Sharing team dashboards. Share dashboards with team members even if they don’t have a UXCam account.


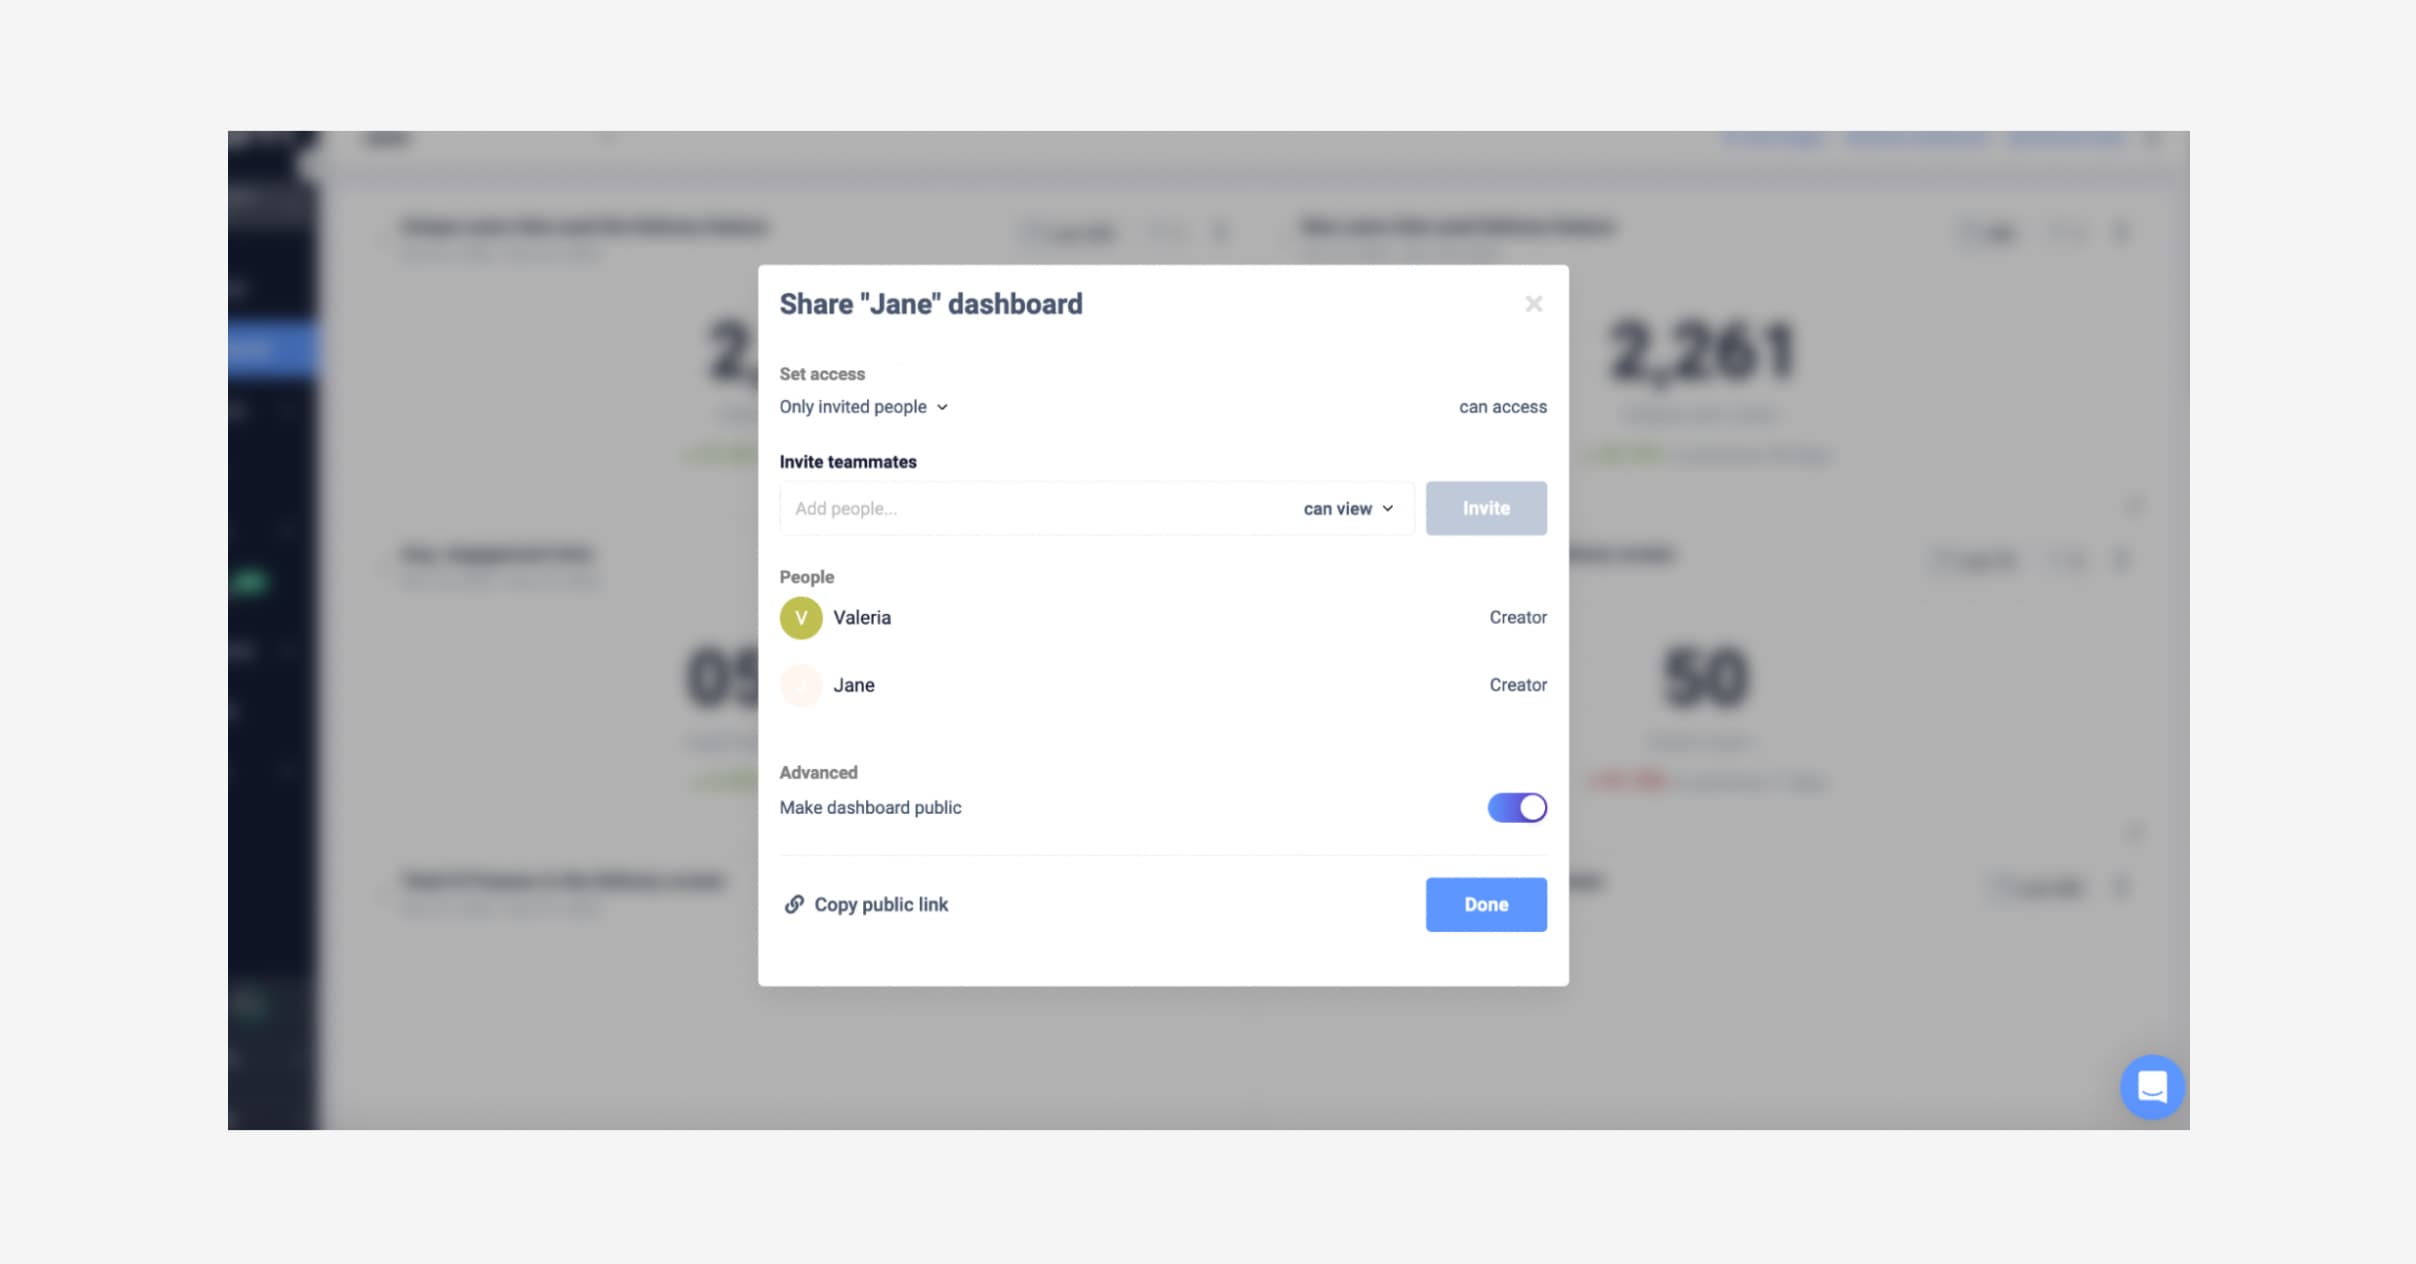
UXCam's customizable dashboard(click to enlarge).
Learn more about all team collaboration tools on UXCam.
With this continuous product of optimizing the user journey — and everyone being able to see what the users sees — you’ll resolve faster. This way, you can spend more time on building and discovery.
There you have it, 3 ways to use UXCam for retention in uncertain market conditions — but also, normal market conditions! We know that pockets are tight these next few months so working with what you have and keeping the users that love you will be a major priority.
These articles might also help you navigate through uncertain times:
AUTHOR
Jane Leung
Product Analytics Expert
Jane is the director of content at UXCam. She's been helping businesses drive value to their customers through content for the past 10 years. The former content manager, copywriter, and journalist specializes in researching content that helps customers better understand their painpoints and solutions.


Related articles


News & Trends
Are the New iOS 15 Features a Game Changer for Mobile UX?
Apple is calling iOS 15 their “biggest update ever”. Let’s dig into the most ground-breaking iOS 15...


Marilyn Wilkinson


News & Trends
No more manual analysis. Meet Tara, your AI Product Analyst.
Tara analyzes session recordings, finds friction, explains why it happens, and recommends what to do next; backed by...


Silvanus Alt, PhD
Founder & CEO | UXCam


News & Trends
Leverage QR Codes to Boost Your Mobile Marketing
QR codes offer a cost-effective way to leverage mobile marketing to drive customer engagement and...


