Top 19 Mobile App Analytics Tools in 2026

With so many mobile app analytics tools competing for a place in your tech stack, finding the right fit can be daunting.
The best mobile app analytics tools combine accuracy, speed, and actionable insights. Leading the list are UXCam, Firebase Analytics, Mixpanel, Userpilot, Amplitude, and AppsFlyer, each tailored to different team needs. This article provides a detailed review of best mobile analytics tool in the market.
Quick Summary - Mobile analytics tools
Here's our pick of the 5 best mobile app analytics tools:
UXCam - Best for mobile product analytics with AI powered insights
Mixpanel - Best for event-based mobile analytics
Amplitude - Best for predictive mobile analytics
Adjust - Best for mobile analytics for marketing
Top mobile app analytics software compared
| Tool | Best For | Platform/OS | Price |
|---|---|---|---|
| UXCam | Product analytics with session replay, heatmaps, and AI-powered insights | iOS / Android / React Native / Flutter /Cordova / Xamarin / .NET/ Web | Free trial, custom pricing |
| Firebase Analytics | Free mobile analytics with Google integration | iOS, Android | Free (pay for other services) |
| Apple App Analytics | Basic iOS app performance tracking | iOS, tvOS | Free |
| Mixpanel | Event-based tracking and user retention | iOS, Android, Web | Free tier, paid from about $33/month |
| Userpilot | Product adoption and in-app engagement | Web, iOS, Android | From $299/month |
| Amplitude | Behavioral cohorts and predictive analytics | iOS, Android, Web | Free tier, paid from $49/month |
| Countly | Self-hosted open-source analytics | iOS, Android, Web | From $40/month |
| Adobe Analytics | Enterprise-level analytics and segmentation | iOS, Android, Web | Custom pricing |
| Glassbox | Digital experience analytics and journey mapping | iOS, Android, Web | Custom pricing |
| Localytics | Mobile marketing automation | iOS, Android | Custom pricing |
| Contentsquare | Experience analytics with struggle analysis | iOS, Android, Web | Custom pricing |
| App Radar | App store optimization and ASO tools | iOS, Android | From $58/month for 2 apps |
| AppsFlyer | Mobile attribution and marketing analytics | Android, iOS, Web, PC, Console, CTV, OTT | From $0.07 per conversion |
| Survicate | In-app surveys and customer feedback | Android, iOS, React Native, Flutter | From $79/month |
| Singular | Unified marketing ROI and attribution | iOS, Android, Unity, C++ | From $0.05 per conversion |
| Adjust | Mobile measurement and fraud prevention | iOS, SKAN, CTV, OTT | Custom pricing |
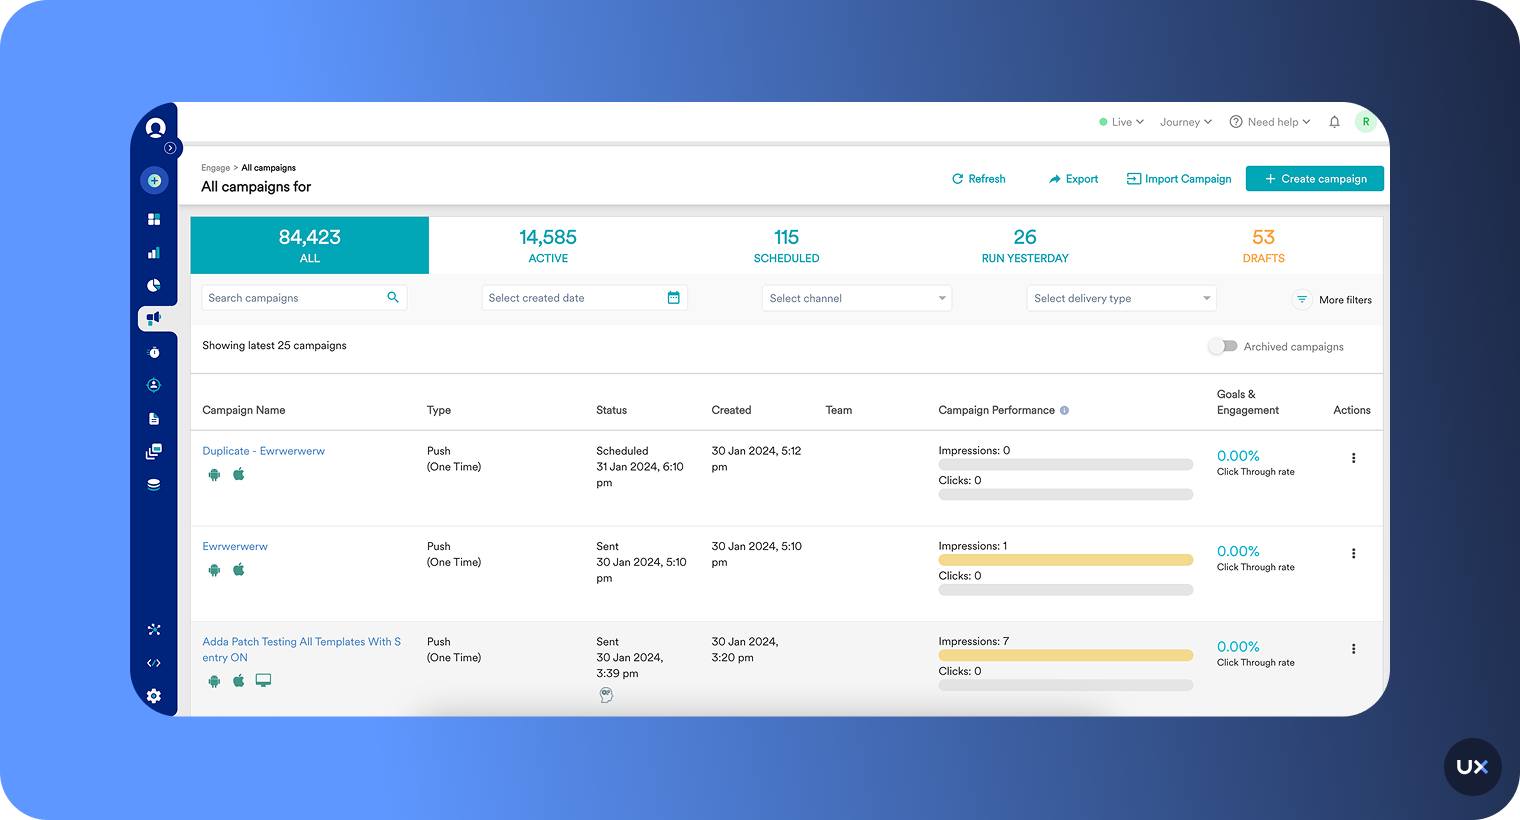
| MoEngage | Customer engagement and retention platform | iOS, Android | Custom pricing |
| Kochava | Unified audience platform with fraud prevention | Multi-platform | From $500/month |
| Woopra | Customer journey analytics across touchpoints | iOS, Android, Web | Free for 500K actions, from $999/month |
What are mobile analytics tools?
Mobile analytics tools are software platforms that track, measure, and analyze user behavior within mobile applications. They capture everything from basic metrics like downloads and sessions to complex behavioral patterns like user flows, feature adoption, and conversion paths.
These tools work by installing an SDK (Software Development Kit) into your mobile app. Once integrated, they automatically collect data about user interactions, technical performance, and business outcomes.
According to Statista, mobile app users worldwide generate over 255 billion app downloads annually, underscoring the need for analytics tools that can uncover how people engage, convert, and retain across devices.
1. UXCam


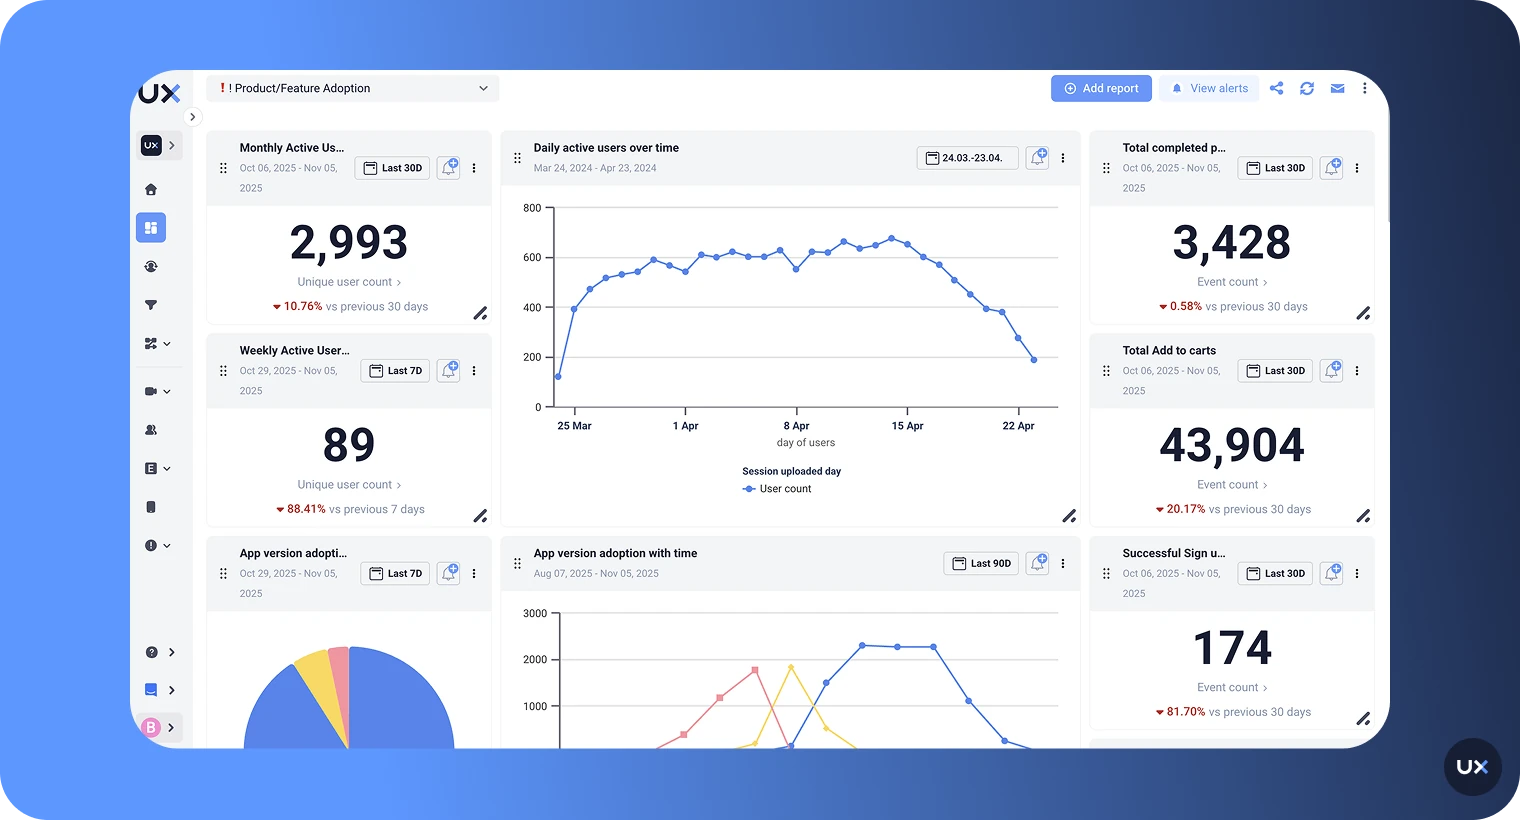
UXCam is the best session recording and product analytics platform for teams that want to understand real user behavior across mobile and web apps.
It combines session replay, heatmaps, and quantitative analytics to show not only what users do, but why they do it. UXCam goes beyond surface-level metrics, giving teams a complete, visual understanding of user journeys, uncovering friction points, and providing the insights needed to improve engagement and retention.
With UXCam, you can;
Get insights into your most important metrics with AI-powered KPI dashboards.
See the hidden story behind user behavior with UXCam's session recordings and heatmaps.
Gain an in-depth understanding of what drives users to convert or drop off with funnel and retention analytics.
Reduce bugs and save developer time with crash analytics - replicate every crash in under 30 seconds.
| G2 Rating | Platform | Price |
|---|---|---|
| 4.7/5 | iOS / Android / React Native / Flutter / .NET/ Web | Free Trial / Pricing Upon Request |
What customers say about UXCam
UXCam is installed in over 37,000 products. Customers have reported higher conversion and retention rates since they started using UXCam. Don't just take our word for it. Here's what the internet has to say about UXCam:


Coca-Cola's Costa Coffee increased user registration by 15% with UXCam.


PlaceMakers doubled sales with UXCam.


Baazar increased items added to cart by 18% with UXCam.


Features
Session Replay: Watch video-style playback of real user sessions to see exactly how people navigate your app, where they struggle, and what leads to conversions or drop-offs
Heatmaps: Visual overlays showing taps, scrolls, and swipes on each screen to surface usability issues and interaction patterns
AI-Powered, Tara AI: AI assistant that answers questions about user behavior
Funnels and Retention Analytics: Visualize conversion paths, identify drop-off points, and track how often users return to your app
Issue Analytics: Real-time tracking of crashes, UI freezes, rage taps, and frustration signals with the ability to replay the exact session where issues occurred
Smart Events and Segmentation: No-code event tracking with retroactive analysis and advanced segmentation by behavior, device, or custom properties
Cross-Platform Support: Unified analytics across iOS, Android, React Native, Flutter, .NET, and Web for complete user journey visibility
Data Hosting and security: Offering data hosting in the USA, EU and UAE.
Pros and Cons
| Pros | Cons |
|---|---|
| Captures micro-interactions and gestures that other tools miss | Limited free plan |
| Combines qualitative insights (session replay, heatmaps) with quantitative analytics (funnels, dashboards) in one platform | Taps are not preserved when videos are exported |
| Lightweight SDK with minimal impact on app performance | |
| Autocaptures screens, gestures, and events, no manual tagging. | |
| Tara AI provides instant answers to product questions without building custom reports |
Pricing
We offer a free plan with up to 3,000 sessions/month. Paid plans are session-based (Starter, Growth, Enterprise) and require custom pricing. Contact us for a 1:1 demo.
2. Firebase


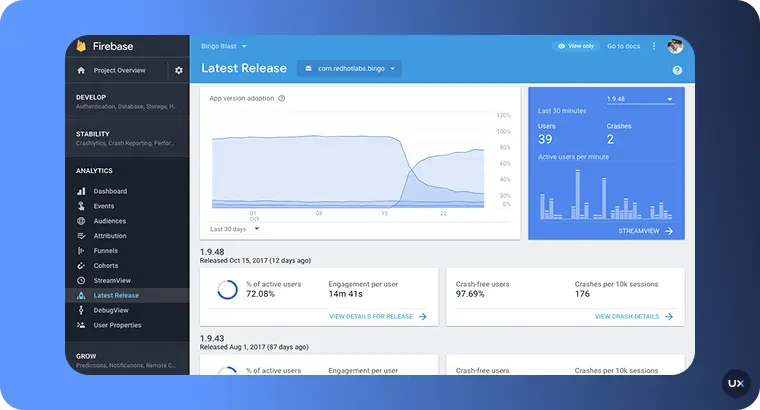
Firebase offers a one-stop shop for app development needs, combining analytics and infrastructure into an all-inclusive service. One of the main advantages of using Firebase is that it offers a wide range of features, including analytics, crash reporting, hosting, and A/B testing, all under a single product.
| G2 Rating | Platform | Price |
|---|---|---|
| 4.6/5 | iOS / Android | Analytics is free, you pay for other services such as app hosting |
Features
Event Tracking: Monitor user interactions with specific elements within your app.
Audience Segmentation: Group users based on shared characteristics or behaviors.
Conversion Tracking: Measure the success of predefined user actions, like making a purchase.
Retention Analysis: Understand how well you retain users over different periods.
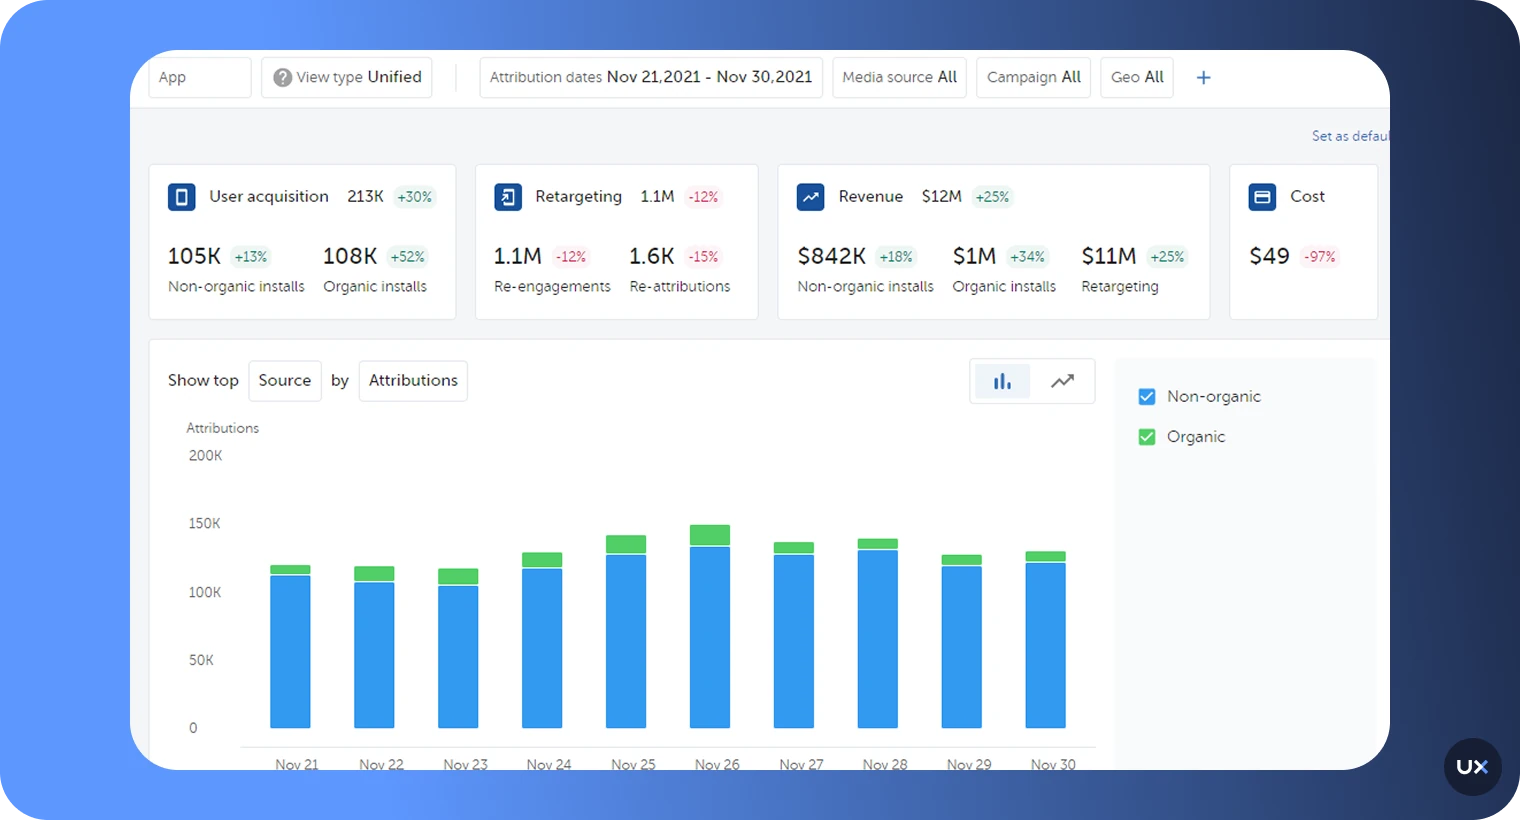
Attribution: Identify where your users are coming from, whether it’s organic search, paid ads, or social media.
Pros and Cons
| Pros | Cons |
|---|---|
| Free to use with robust functionalities. | Less intuitive UI compared to some competitors. |
| Real-time tracking and reporting. | Limited customization compared to some other analytics platforms. |
| Seamless integration with other Firebase tools. | Data is sampled, which might affect the accuracy of reports in high-traffic apps. |
| Comprehensive reports on user behavior and engagement. | Privacy concerns due to data storage on Google's servers. |
| Supports both app and web analytics. |
3. Mixpanel


Mixpanel tracks user interactions and allows you to build custom reports. This mobile app analytics platform lets you evaluate user actions by segmenting them and creating funnels. In addition to tracking user interactions, Mixpanel also provides information about data points such as location, device, and channels, which can give you insights into your users' demographics and behavior.
| G2 Rating | Platform | Price |
|---|---|---|
| 4.5/5 | iOS / Android / Web | Free / Paid (starts at about $33/month for 10k events) |
Features
Event Tracking: Monitor user actions in real-time to understand how people interact with your app.
Segmentation: Break down your user base into segments to get detailed insights on specific groups.
Funnel Analysis: Identify where users drop off in their journey and optimize conversion rates.
Retention Reports: Track how well you’re retaining users over time and what features keep them coming back.
Cohort Analysis: Group users based on their behavior or demographics for deeper insights.
Pros and Cons
| Pros | Cons |
|---|---|
| Highly flexible event tracking with custom properties and nested data | Time-intensive setup requiring careful event planning and instrumentation |
| Powerful segmentation capabilities for detailed cohort analysis | No session replay or qualitative insights to see actual user behavior |
| Fast query performance even with large datasets | Limited date range for some analyses on the free tier |
| Strong funnel and retention analysis tools | Primarily built for web, mobile tracking capabilities lag behind |
| User-friendly interface once events are configured |
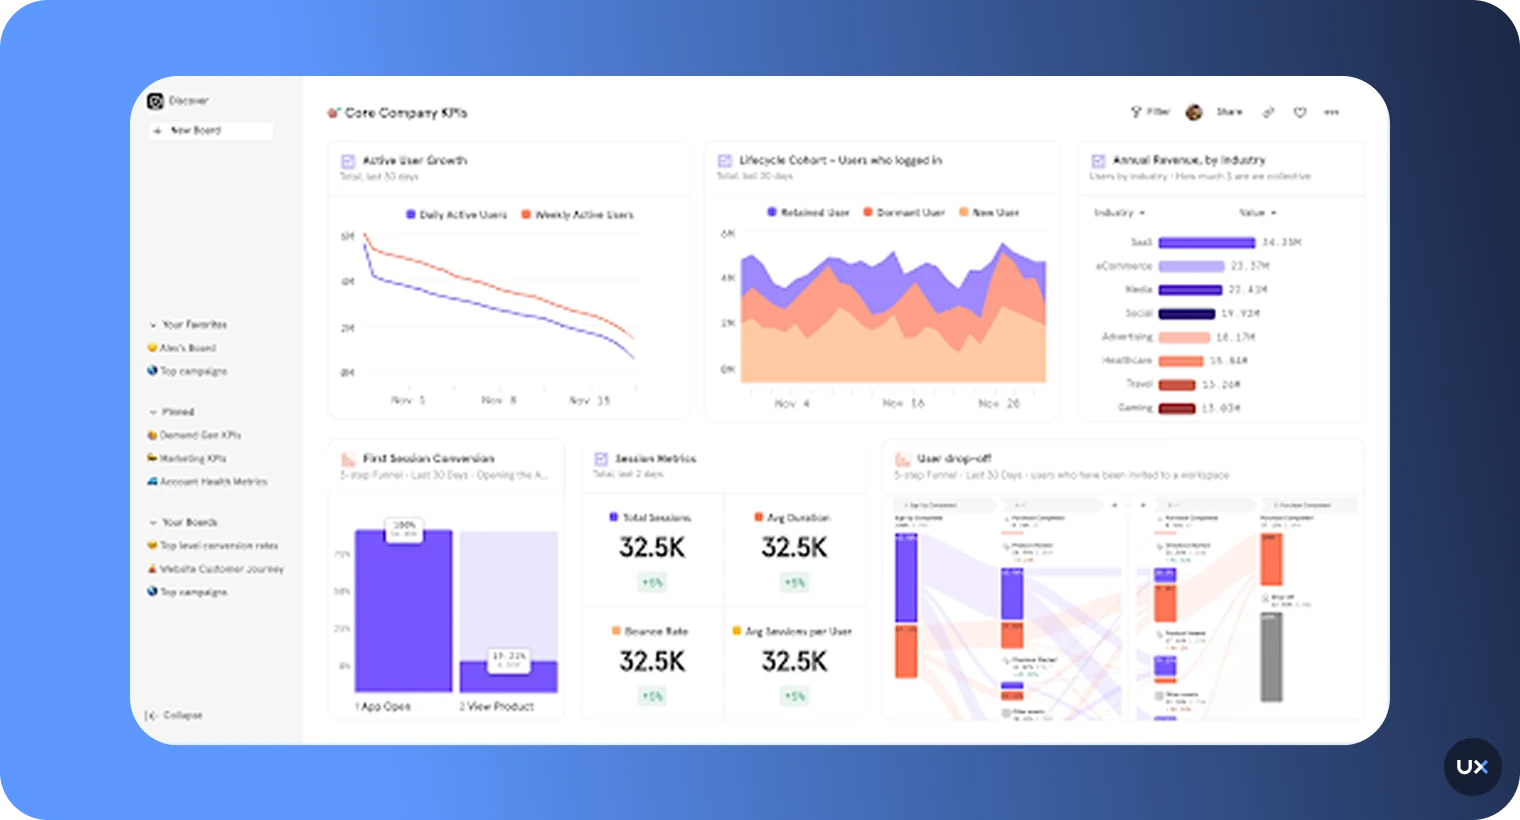
4. Userpilot


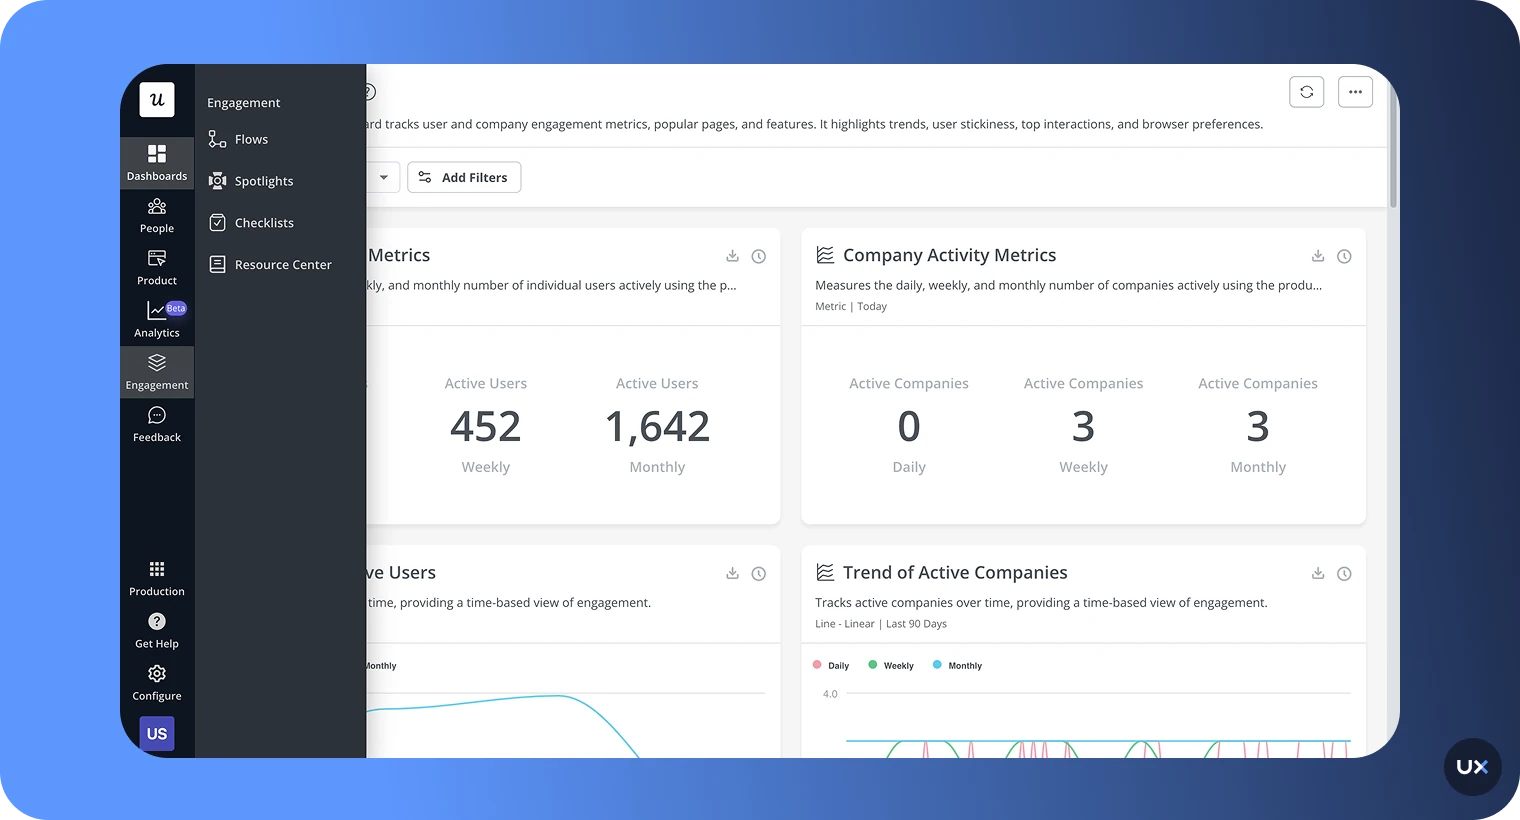
Userpilot is a comprehensive product growth platform that offers powerful analytics and engagement tools for both web and mobile applications. The platform enables product teams to understand user behavior, create personalized onboarding experiences, and improve product adoption without requiring technical expertise.
| G2 Rating | Platform | Price |
|---|---|---|
| 4.7/5 | Web / iOS / Android | Growth plan starts at $299/month (mobile is an add-on) |
Features
Cross-Platform Analytics: Unified analytics for web and mobile, allowing you to track the entire user journey in one place.
Custom Dashboards: Build flexible datasets and reports tailored to your specific product goals and team needs.
Mobile Screen Analytics: Monitor key metrics and user flows to identify friction points and optimization opportunities.
Advanced Segmentation: Group users based on behavior, demographics, or custom properties for targeted analysis.
In-App Engagement Tools: Create mobile carousels, slideouts, and push notifications without code.
Pros and Cons
| Pros | Cons |
|---|---|
| All-in-one solution combining analytics and engagement tools | Higher price point compared to analytics-only tools |
| Mobile-optimized UI components that feel native to the app | Mobile features only available as an add-on to paid plans |
| No-code builder for product managers and marketers | May require setup time to configure dashboards properly |
| Unified analytics across web and mobile | More focused on product engagement than deep technical analytics |
| Built-in user feedback tools with multiple survey types |
5. Amplitude


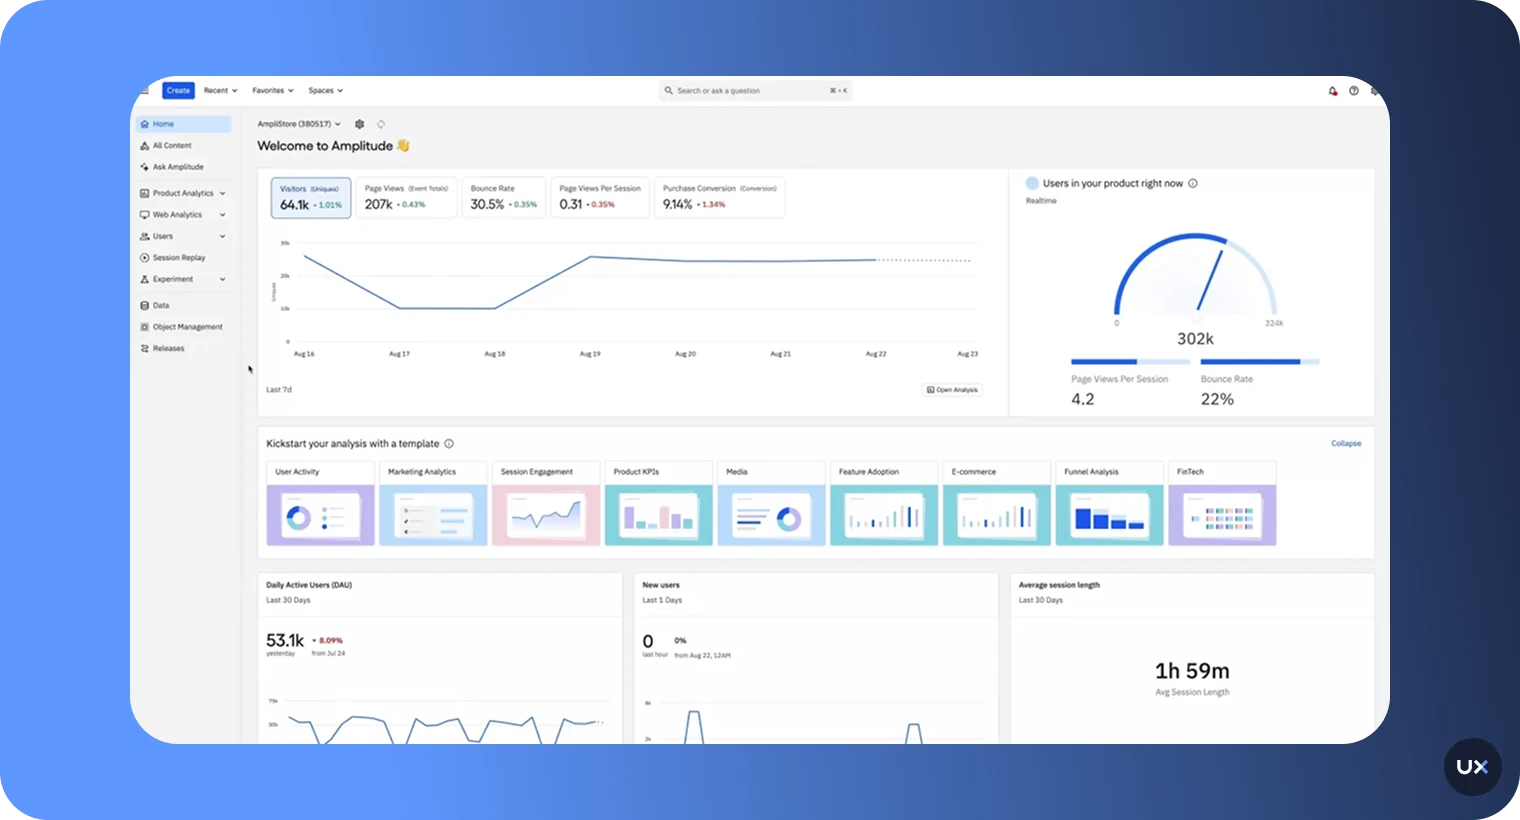
Amplitude is a robust quantitative analytics tool. Its features and use cases are comparable to those of Mixpanel. One of the key features of Amplitude is its ability to track user actions and analyze user behavior. It provides a range of tools and metrics that can help you understand how users are interacting with your app. You can also use Amplitude to create custom reports and funnels to understand how users are progressing through your app and identify any areas where they may be struggling or dropping off.
| G2 Rating | Platform | Price |
|---|---|---|
| 4.5/5 | iOS / Android | Free / Paid (starts at $49/month for 1k MTUs). |
Features
User Journey Tracking: Examine the paths users take through your app to identify opportunities and pitfalls.
Segmentation: Break down your audience into distinct groups to analyze specific behaviors and characteristics.
Retention Analysis: Measure how well you keep users engaged over a defined period.
Funnel Analysis: Understand where users drop off and how they move through different stages of your app.
Behavioral Cohorts: Create user segments based on behavior patterns to tailor your engagement strategies.
Pros and Cons
| Pros | Cons |
|---|---|
| Generous free tier for startups and small teams | No autocapture, requires manual event instrumentation |
| Powerful behavioral cohort analysis | Significant price jump from free to paid tiers |
| Fast query performance with large datasets | No session replay or qualitative insights |
| Strong funnel and retention analytics | Time-intensive to properly configure events and properties |
| Predictive features help identify at-risk users |
6. Countly


Countly provides an overall analytics picture for web and mobile. It offers a real-time, open-source mobile analytics application that can be hosted on your own servers. One of the key features of Countly is its ability to track user behavior and provide a range of metrics and tools for understanding user actions. It offers a range of features for tracking user events, analyzing user demographics, and identifying areas for improvement.
| G2 Rating | Platform | Price |
|---|---|---|
| 4.1/5 | iOS / Android / Web | Paid plans start at $40 per month |
Features
Open-Source Platform: Full access to source code with the ability to customize and extend functionality
Self-Hosted Deployment: Host on your own servers or private cloud for complete data control
Plugin Architecture: Extend capabilities with plugins for push notifications, crash reporting, and more
Retention and Funnel Analysis: Track user return rates and conversion through multi-step flows
Push Notification Management: Send targeted push campaigns directly from the platform
Pros and Cons
| Pros | Cons |
|---|---|
| Open-source with full code access for customization | Smaller community and ecosystem than proprietary tools |
| Self-hosting option for complete data control | Limited cohort and advanced event tracking |
| Plugin system allows extending functionality | Time-intensive setup, especially for self-hosted deployment |
| Push notification capabilities built-in | Requires technical expertise to maintain and customize |
| Competitive pricing for cloud-hosted version |
7. Apple App Analytics


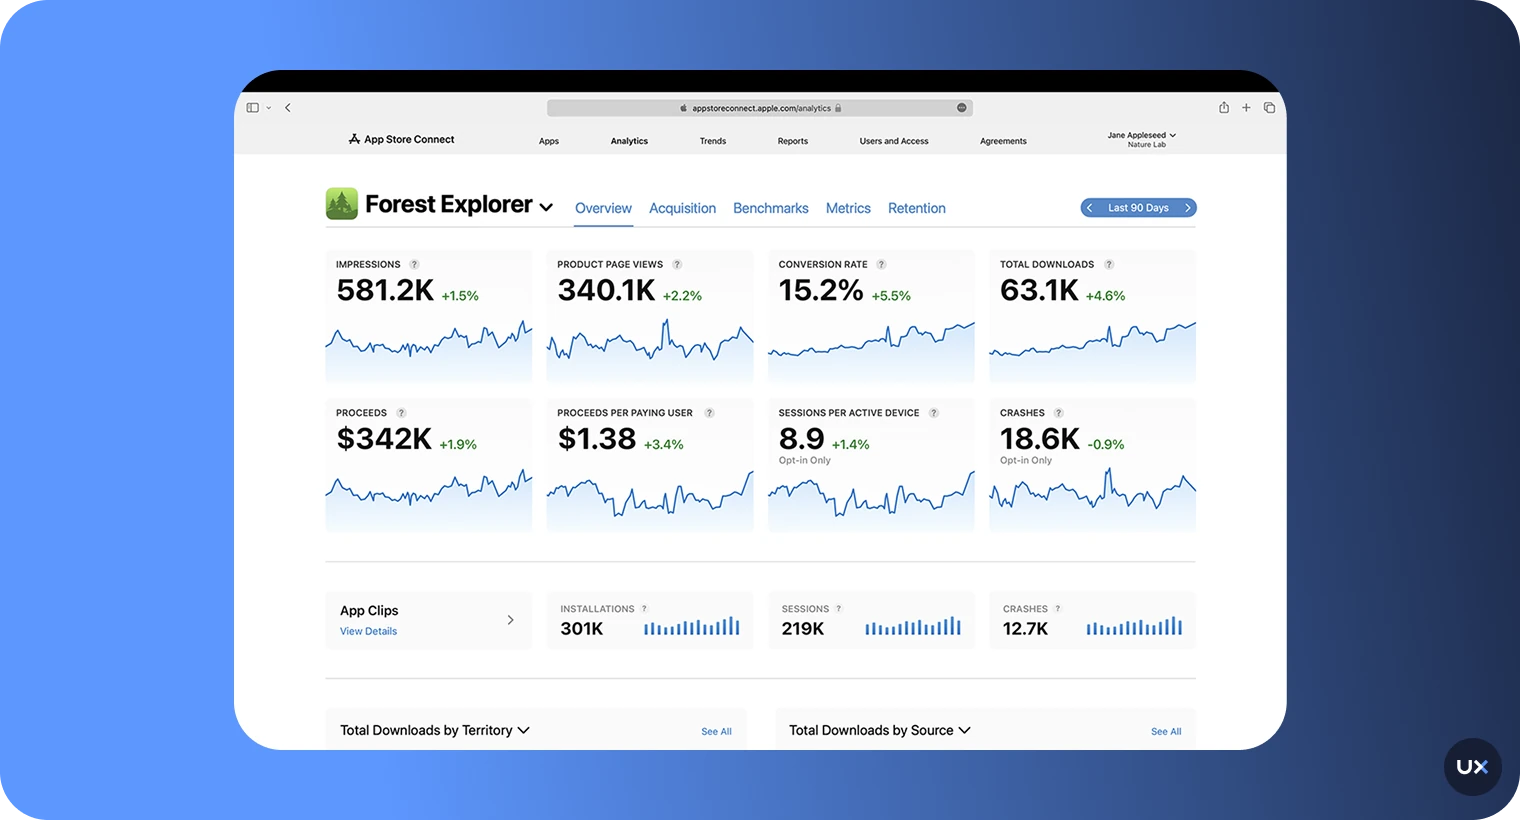
Apple App Analytics, available through the Apple Developer Program, is a built-in analytics tool that requires no additional setup or SDK integration. It automatically provides insights into app performance, marketing effectiveness, and user engagement directly from your App Store data. While Apple App Analytics offers a solid starting point, especially for iOS-only apps, it’s best used alongside a more advanced analytics solution to gain deeper behavioral insights and cross-platform visibility.
| G2 Rating | Platform | Price |
|---|---|---|
| N/A | iOS / tvOS | Free |
Features
App Store Performance: Track impressions, product page views, and download conversion rates
Basic Usage Data: Monitor app installations, sessions, and active devices
Sales Data: View in-app purchase revenue and transaction volumes
Campaign Tracking: Measure effectiveness of marketing campaigns and acquisition sources
No Implementation Required: Data available automatically through App Store Connect.
Pros and Cons
| Pros | Cons |
|---|---|
| Free access with no additional cost | iOS and tvOS only, no Android support |
| No SDK implementation required | No in-app behavioral analytics or event tracking |
| App Store-specific metrics unavailable elsewhere | Shows only basic KPIs without deeper insights |
| Basic campaign tracking for user acquisition | Cannot track custom events or user flows |
| Integrated directly into App Store Connect |
8. Adobe Analytics


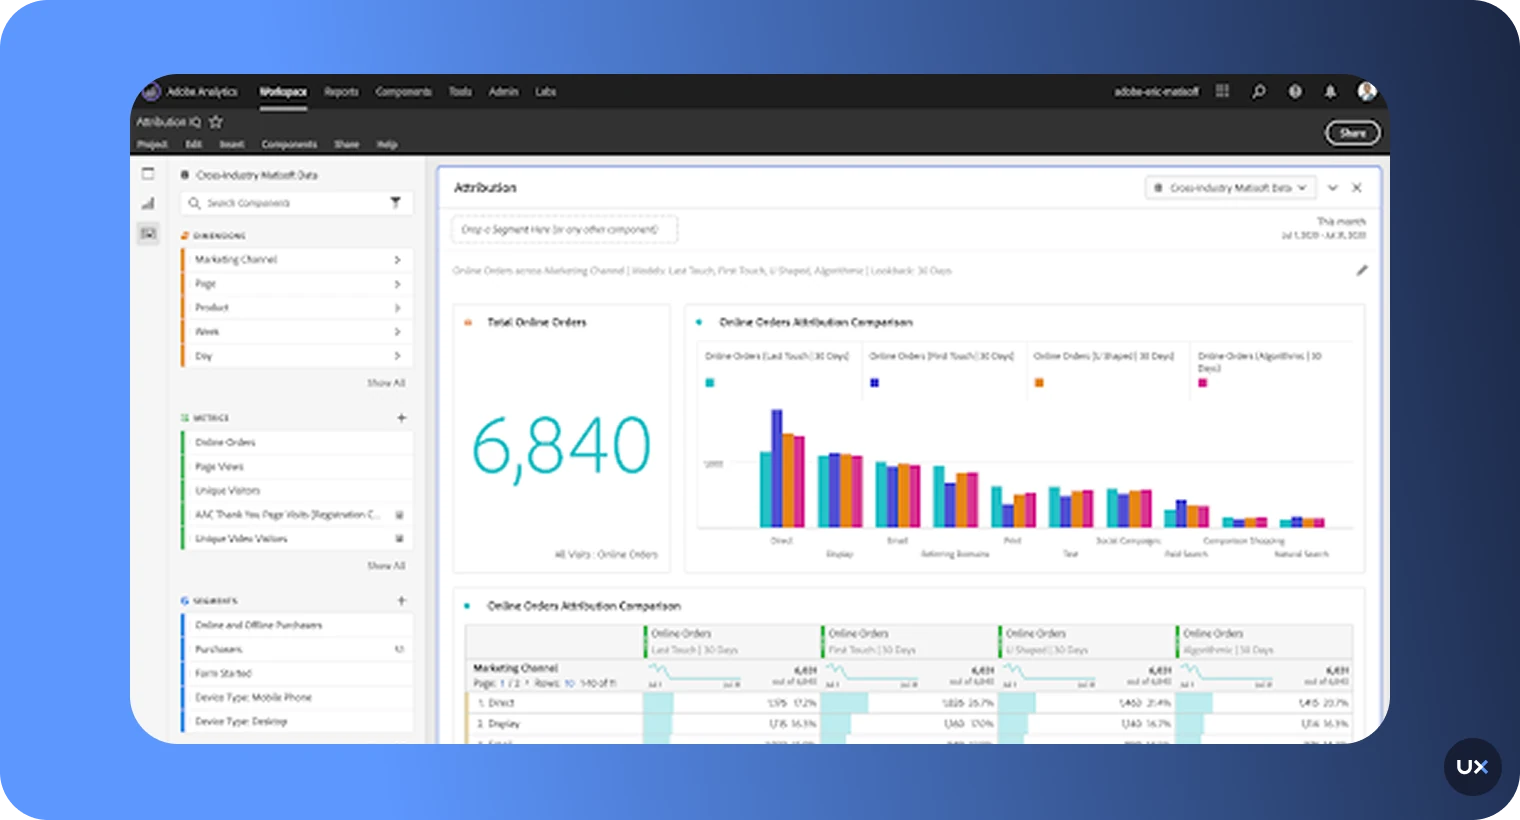
Adobe Analytics gives you the tools you need to understand your users. This app analytics tool is priced for enterprise clients only. It provides a range of features for tracking and analyzing user behavior, including tools for identifying trends and patterns, measuring the effectiveness of marketing campaigns, and understanding customer journeys. To learn more about customer journeys, read our guide on the mobile app customer journey.
| G2 Rating | Platform | Price |
|---|---|---|
| 4.1/5 | iOS / Android | Pricing upon request |
Features
Cross-Channel Analytics: Track user journeys across mobile apps, web, email, and offline channels
Advanced Segmentation: Create complex audience segments using virtually any data combination
Attribution Analysis: Understand which channels and touchpoints drive conversions
Flow Visualization: Explore user paths through your app with interactive flow diagrams
Cohort Analysis: Group users by shared characteristics and track behavior over time.
Pros and Cons
| Pros | Cons |
|---|---|
| Extremely powerful analysis capabilities for enterprise needs | Complex implementation requiring specialized expertise |
| Advanced attribution and contribution analysis | High entry price point, not suitable for small businesses |
| Highly customizable reporting and segmentation | Difficult to use without dedicated training |
| Strong support for complex, multi-channel customer journeys | Long setup time before generating useful insights |
| Works across mobile, web, and offline touchpoints |
9. Glassbox


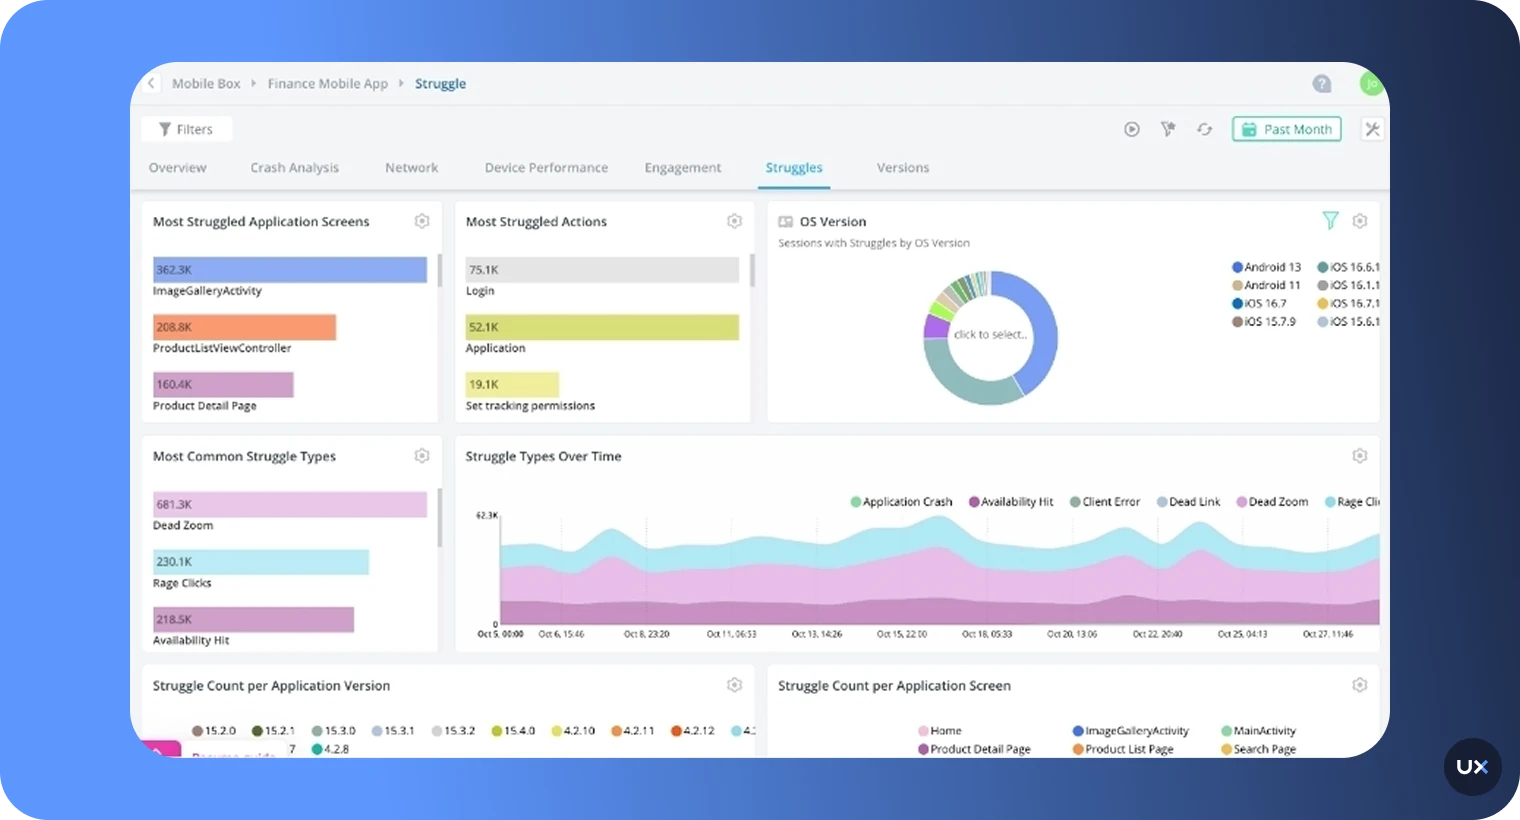
Glassbox provides digital experience analytics across mobile and web. They focus on journey mapping but have many more features, listed below. However, it is not as comprehensive or feature-rich as some of the other options on the market. It may lack some of the advanced tracking and analysis tools offered by other platforms, and may not be as scalable or flexible in terms of integrations and customization.
| G2 Rating | Platform | Price |
|---|---|---|
| 4.7/5 | iOS / Android / Web | Pricing upon request |
Features
Automatic Session Capture: Records every user session without manual event tagging
Crash Analytics: Identifies and diagnoses technical errors with full session context
Network Performance Monitoring: Tracks API calls, load times, and connectivity issues
Struggle Detection: Automatically flags sessions where users show signs of frustration
AI-Powered Insights: Machine learning surfaces patterns and anomalies automatically.
Pros and Cons
| Pros | Cons |
|---|---|
| Intuitive interface with easy-to-understand visualizations | No free trial available to test before purchasing |
| Automatic data capture reduces implementation effort | Reporting could provide more depth for advanced analysis |
| Strong session replay capabilities across web and mobile | Frustration tracking features need improvement |
| User identification helps connect anonymous and known users | Custom pricing can be expensive for smaller companies |
| Good conversion funnel analysis |
10. Localytics


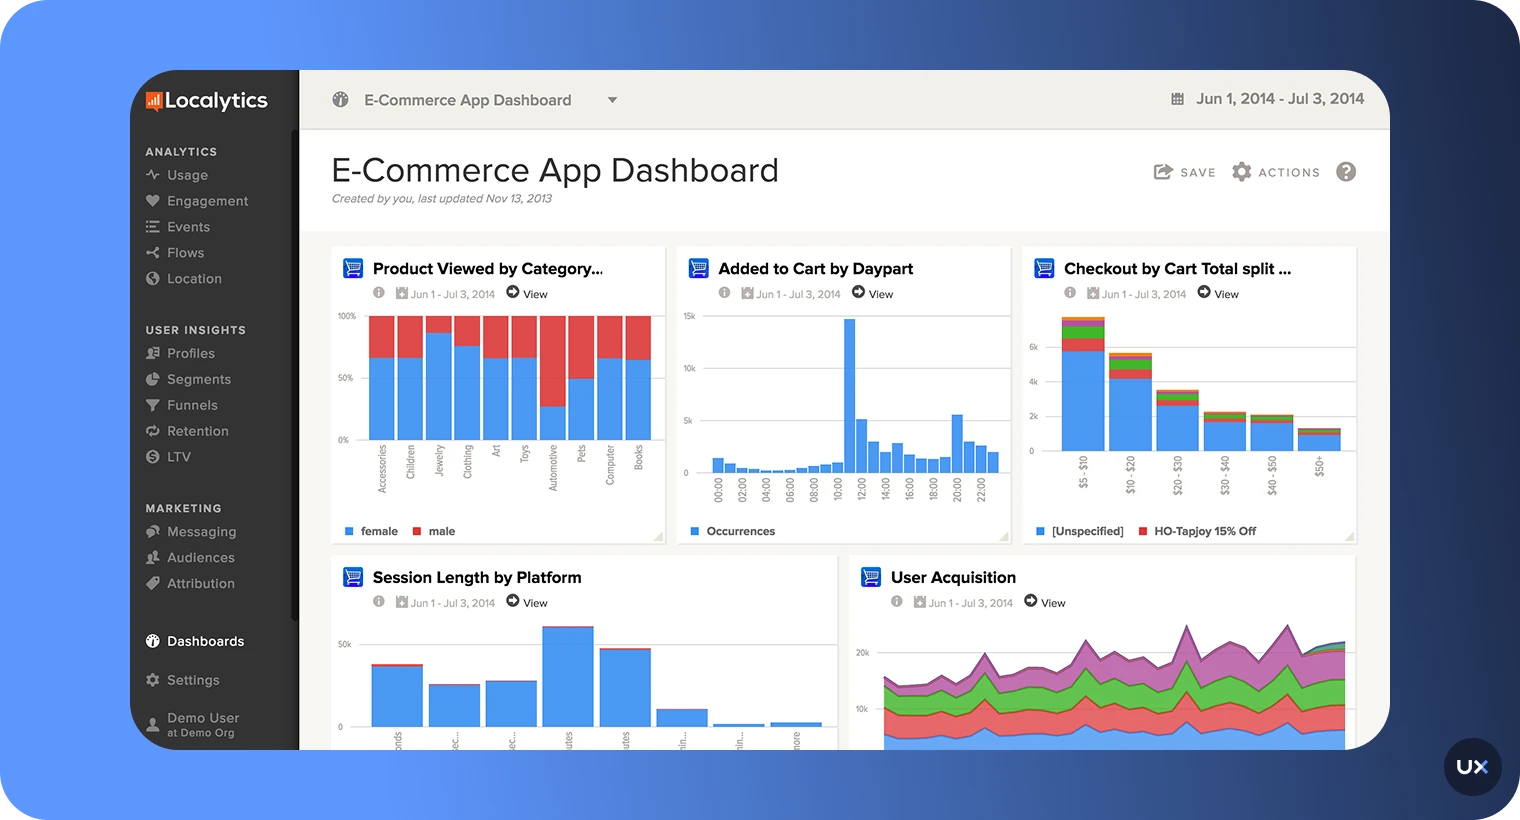
Upland Localytics is a mobile app marketing and analytics platform designed to help brands build stronger relationships with their users. It combines user insights with advanced engagement tools to deliver personalized experiences that drive loyalty and retention. At its core, Localytics excels in push notifications, allowing marketers to create dynamic, behavior-based campaigns that reach users at the right moment.
| G2 Rating | Platforms | Price |
|---|---|---|
| 3.9/5 | iOS / Android | Pricing upon request |
Features
Marketing Analytics: Track sessions, events, and user acquisition with a focus on marketing metrics
Attribution Modeling: Understand which channels and campaigns drive app installs
Uninstall Tracking: Detect when users uninstall your app and analyze contributing factors
Lifetime Value (LTV) Analysis: Calculate and track user value over time
Mobile CRM: Build user profiles and segment audiences for targeted messaging
Pros and Cons
| Pros | Cons |
|---|---|
| Segmented push notifications | Limited product analytics features |
| Good for tracking user acquisition and campaign performance | No session replay or qualitative insights |
| Mobile CRM features for audience management | User interface feels dated compared to modern tools |
| Uninstall tracking provides unique insights | Fewer advanced features than dedicated analytics platforms |
| Cloud support for scalability |
11. Contentsquare


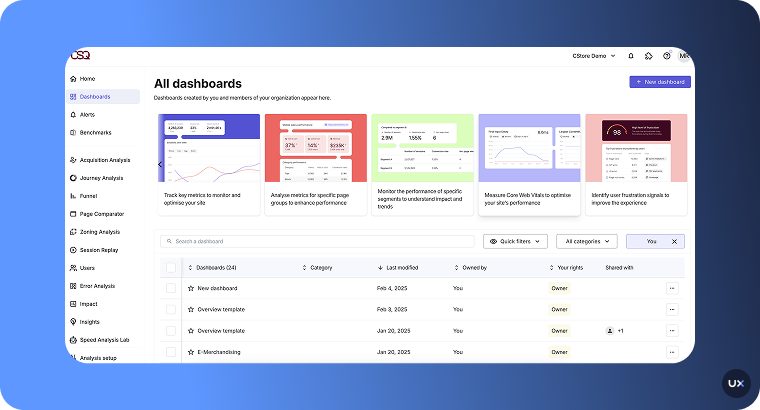
Contentsquare is primarily known for its web analytics expertise, but also offers an advanced solution for mobile app analytics. It helps teams understand how users interact with their apps, what draws engagement, where users face friction, and why some decide to uninstall. Although it’s more widely used for web analytics, its mobile solution provides valuable cross-platform visibility, making it ideal for companies seeking to enhance digital experiences across both web and mobile.
| G2 Rating | Platforms | Price |
|---|---|---|
| 4.6/5 | iOS / Android / Web | Pricing upon request |
Features
Zone-Based Heatmaps: Analyze engagement with screen areas rather than just specific elements.
Session Replay: Watch recordings of real user sessions to understand behavior patterns.
Journey Analysis: Visualize complete user paths across multiple sessions and touchpoints.
Struggle Scoring: AI identifies sessions where users show frustration or confusion.
A/B Testing Integration: Connect test results with behavioral data for deeper insights.
Pros and Cons
| Pros | Cons |
|---|---|
| Good support and onboarding | Mapping feature could be improved for complex apps |
| Clear and easy-to-interpret data | Steep learning curve for new users |
| Zoning analysis and session replay | No free trial period |
| Integration with AB testing tools | Enterprise-focused pricing not suitable for small teams |
| AI-powered struggle detection |
12. App Radar


App Radar enhances app visibility, improving your user acquisition rates. The platform offers a unique combination of AI-powered tools that draw from a significant pool of data, making it easier for app developers and marketers to achieve growth and success with their apps. Beyond ASO, App Radar provides comprehensive performance tracking, from measuring installs and reviews to analyzing marketing campaign results.
| G2 Rating | Platform | Price |
|---|---|---|
| 4.4/5 | iOS/Android | Paid plans start at $58/month for 2 apps |
Features
Keyword Research and Tracking: Find high-value keywords and monitor rankings over time
App Store Performance Metrics: Track impressions, conversions, and download trends
Ratings and Reviews Management: Aggregate and analyze user feedback across app stores.
Conversion Rate Optimization: Test and optimize store listings for better conversion.
App Health Dashboard: Unified view of essential ASO metrics and performance indicators.
Pros and Cons
| Pros | Cons |
|---|---|
| User-friendly interface | Lacks in-depth app analysis |
| Comprehensive functionality for higher app rankings | Inability to customize reports |
| Effective keyword tracking | Absence of readily available metrics |
| Efficient onboarding process | Doesn't track post-install engagement or retention |
| Instant optimization score feedback for user acquisition |
13. AppsFlyer


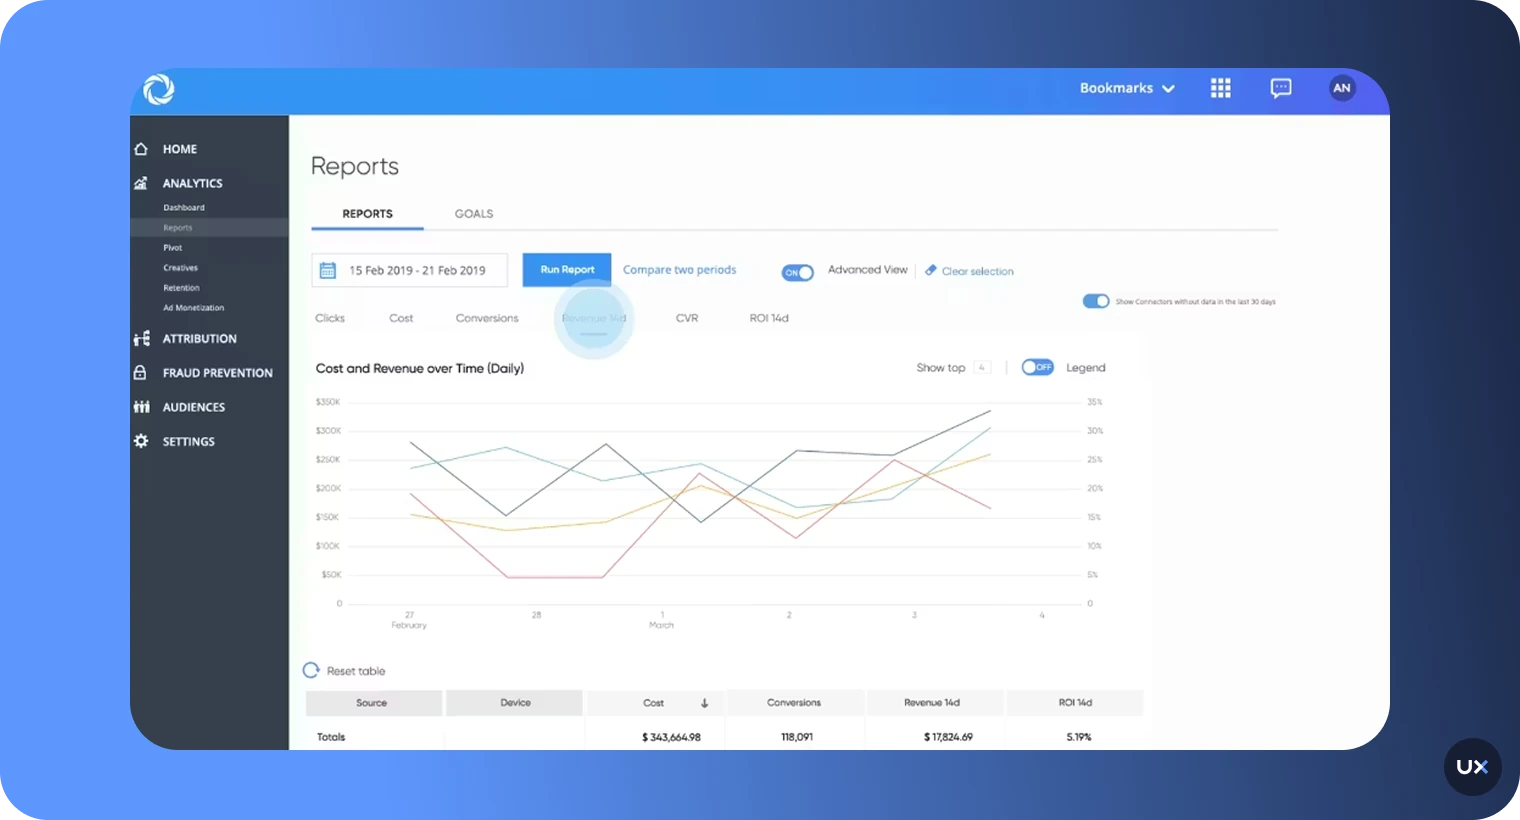
AppsFlyer provides a wide range of features across its plans, from basic analytics tools to advanced solutions like fraud protection, audience segmentation, and custom APIs. Users can choose the plan that best fits their requirements to leverage the platform's capabilities for app growth and optimization.
| G2 Rating | Platform | Price |
|---|---|---|
| 4.4/5 | Android / iOS / Web / PC / Console / CTV / OTT | Paid plans start from $0.07 per conversion |
Features
Mobile Attribution: Track which marketing channels and campaigns drive installs and conversions
Multi-Touch Attribution: Understand the complete customer journey across multiple touchpoints
Fraud Prevention: Detect and block fraudulent installs and engagement
Audience Segmentation: Create cohorts based on acquisition source and behavior
Privacy-Compliant Tracking: Support for iOS SKAdNetwork and Android Privacy Sandbox
Pros and Cons
| Pros | Cons |
|---|---|
| Seamless integration capabilities | Needs improvement in evaluating affiliate partners |
| Multi-channel attribution and analytics | Challenges in distinguishing between actual and cohort revenues |
| Real-time reporting & tracking | Limited dashboard customization |
| Extremely competitive pricing | Focuses on marketing metrics rather than product analytics |
| Strong fraud detection and prevention |
14. Survicate


Survicate is a survey tool used to collect customer feedback across various channels, including mobile apps, email, websites, and products. It’s user-friendly, allowing you to set up and launch surveys in minutes, all thanks to its AI-powered survey creator and pre-made templates. With Survicate, you can run surveys on specific screens and events within the mobile app and select a group of users you want to collect feedback from based on factors such as traits, the device used, or the operating system.
| G2 Rating | Platform | Price |
|---|---|---|
| 4.6/5 | Android, iOS, React Native, Flutter, Unity SDK, Segment Integration | Paid plans start from $79 per month |
Features
In-App Surveys: Deploy surveys on specific screens or trigger them based on user actions
AI Survey Creator: Generate survey questions automatically based on your goals
Survey Templates: Pre-built NPS, CSAT, CES, and custom survey templates
Advanced Targeting: Show surveys to specific user segments based on traits or behavior
Survey Logic: Create branching surveys that adapt based on user responses
Pros and Cons
| Pros | Cons |
|---|---|
| Clear and simple integration process | Limited answering options |
| Comprehensive reporting and analytics | Limited customization options on the free plan |
| Excellent customer support and resources | Some integrations are only available on premium plans |
| AI-powered text analysis saves manual review time | Doesn't track behavioral analytics, focuses only on surveys |
| Survey sampling to control response volume |
15. Singular


Singular focuses on empowering marketers to achieve a complete view of their marketing ROI by integrating next-gen attribution with full-funnel marketing data and robust fraud prevention mechanisms. The platform stands out for its ability to measure and report across all marketing channels, including apps, web, SMS, referrals, email, and TV, through an open integration framework.
| G2 Rating | Platform | Price |
|---|---|---|
| 4.5/5 | C++, iOS, Unity, Android | Paid plans start at $0.05 per conversion |
Features
Unified Attribution: Track user acquisition across all marketing channels in one place
Cost Aggregation: Automatically import ad spend from all networks for accurate ROI
Fraud Prevention: ML-powered fraud detection with quality scores for traffic sources
Creative Analytics: Measure performance of specific ad creatives and variations
SKAdNetwork Support: iOS 14+ privacy-compliant attribution.
Pros and Cons
| Pros | Cons |
|---|---|
| AI-driven market and keyword intelligence | Limited customization options |
| Time-saving app store management | Basic analytical insights |
| Comprehensive cost aggregation across channels | Focuses entirely on marketing, no in-app behavioral tracking |
| Works with leading marketing teams globally | Requires ongoing data hygiene and management |
| Good integration with major ad networks |
16. Adjust


Adjust operates as a part of AppLovin, catering to a global market. It's designed to serve marketers aiming to scale their apps across multiple platforms, including mobile and CTV. The platform is suitable for a diverse range of clients, from fast-growing digital brands to traditional companies venturing into mobile apps.
| G2 Rating | Platform | Price |
|---|---|---|
| 4.1/5 | iOS / SKAN / CTV / OTT | Pricing upon request |
Features
Cross-Platform Attribution: Track user acquisition across mobile, CTV, and OTT
SKAdNetwork Measurement: Privacy-compliant iOS attribution
Fraud Prevention Suite: Detect and block fraudulent installs and engagement
Audience Segmentation: Build cohorts based on acquisition and behavior
Data Residency Options: Choose where your data is stored for compliance
Pros and Cons
| Pros | Cons |
|---|---|
| Detailed analytics | Complex user interface |
| Reliable attribution for optimizing campaigns | Steep learning curve |
| Strong fraud prevention capabilities | Custom pricing lacks transparency |
| Unlimited raw data access for custom analysis | Setup requires technical expertise |
| Privacy-compliant measurement solutions |
17. MoEngage


MoEngage is favored for its user-friendly interface, robust feature set, and strong customer support. However, it has room for improvement in pricing and some aspects of its performance and features. For those seeking a comprehensive marketing automation tool with excellent analytics and reporting capabilities, MoEngage delivers.
| G2 Rating | Platform | Price |
|---|---|---|
| 4.5/5 | iOS / Android | Pricing available upon request |
Features
Behavioral Analytics: Track user actions and identify trends across cohorts
Funnel and Cohort Analysis: Measure conversion rates and retention by user segments
AI-Powered Predictions: ML models forecast churn, conversions, and lifetime value
Unified Customer Profiles: Complete view of each user across all touchpoints
Dynamic Segmentation: Create audience segments that update automatically based on behavior
Pros and Cons
| Pros | Cons |
|---|---|
| Customer journeys unified profile | Very expensive to use |
| Detailed personalization | Integration challenges with other tools |
| Uses AI and ML to predict actions | Overwhelming for complex cases |
| Multichannel transactional alerts | Limited personalized communication options |
| Good for retention and lifecycle marketing |
18. Kochava


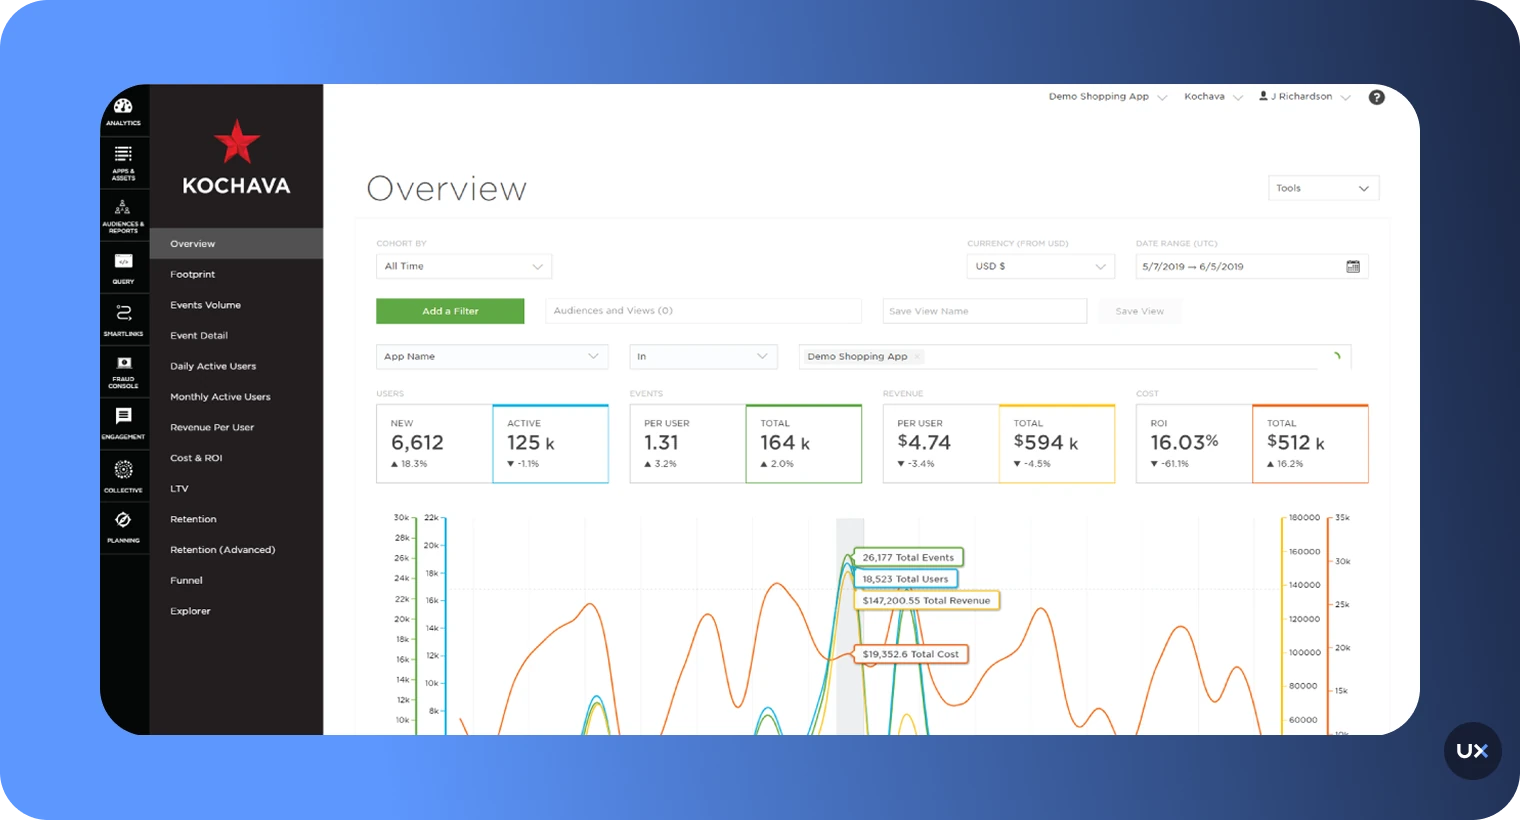
Kochava stands out as a comprehensive solution for mobile app analytics and attribution, providing valuable insights and tools for marketers to help them optimize their campaigns. Its focus on real-time data, user engagement, and fraud prevention, combined with extensive support and training options, makes it a solid choice for businesses aiming to improve their mobile app performance.
| G2 Rating | Platform | Price |
|---|---|---|
| 4.0/5 | Various | Enterprise: starting at $2,000.00 per month; Foundation: $500.00 per month |
Features
Real-Time Attribution: Instant visibility into campaign performance and user acquisition
Unified Audience Platform: Build and activate audience segments without data movement
Fraud Prevention: Detect and prevent mobile ad fraud across acquisition channels
Cost Analytics: Import ad spend from networks for accurate ROI measurement
Privacy Compliance: Support for iOS SKAdNetwork and privacy regulations
Pros and Cons
| Pros | Cons |
|---|---|
| Instant app activity | Steep learning curve for new users |
| Campaign performance visualizations | Lacks a direct password reset option |
| Detects and prevents mobile ad fraud | Data extraction methods are potentially confusing |
| Automated, customizable push notifications | Requires technical knowledge to maximize value |
| Accessible customer support |
19. Woopra


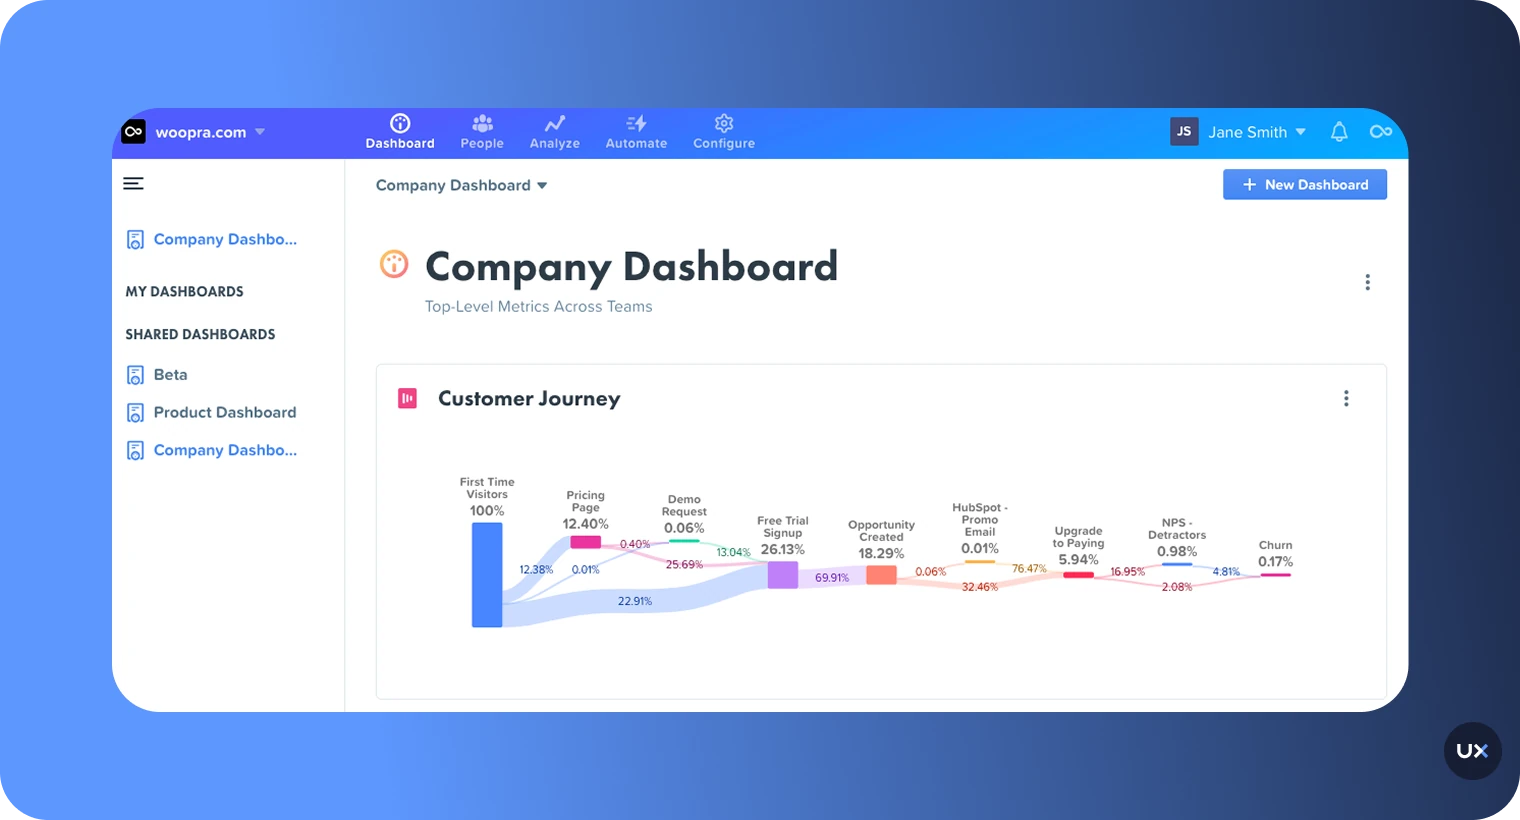
Woopra is a real-time customer analytics service used by sales, service, and marketing teams to optimize customer engagements and improve conversion rates. It tracks users' activity across multiple touchpoints, integrating web, mobile, email, help desk, and more. While Woopra is notable for its ability to integrate with several different marketing channels, the learning curve with this tool can be a bit prohibitive.
| G2 Rating | Platform | Price |
|---|---|---|
| 4.4/5 | iOS / Android / Web | $0 for 500,000 actions/month and $999 for up to 5 million actions/month. Starter plan starts at $49/month |
Features
Customer Journey Analytics: Map complete user paths across all touchpoints and channels
Behavioral Segmentation: Create dynamic user segments based on actions and properties
Individual Customer Profiles: Detailed view of each user's complete history
Retention Analytics: Measure how often users return and what drives engagement
Automated Triggers: Execute actions based on user behavior patterns
Pros and Cons
| Pros | Cons |
|---|---|
| Real-time analytics | Complex and challenging to use |
| Quick customer follow-ups | Difficulties in adapting to the new user interface |
| Broad integrations cater to diverse business needs | Requires significant setup for full value |
| Individual customer profiles for personalized engagement | Limited compared to specialized product analytics tools |
| Generous free tier for smaller apps |
How to buy a mobile app analytics software
Understanding user behavior is essential for the success of your mobile app. Mobile app analytics software provides invaluable insights into user engagement, retention, and other crucial metrics.
1. Identify your requirements
Before you start shopping for mobile app analytics software, it's important to determine your specific needs. Ask yourself the following questions:
What are your app's main objectives?
Which metrics are most important to you?
Do you require real-time analytics?
Are you interested in user behavior or just the raw numbers?
Do you need to integrate the analytics software with other tools?
Answering these questions helps you narrow down your search and find the ideal software for your app.
2. Research available options
To find the perfect mobile app analytics tool, you'll need to do a bit of research. Fortunately, plenty of options are available, including trusted providers like UXCam, Firebase, Mixpanel, and Amplitude. Reading reviews and asking for recommendations from fellow professionals can help you make an informed decision. Of course, when choosing a tool, it's important to compare features, pricing, and level of support to ensure you're getting the best fit for your needs.
3. Consider UX and ease of use
A great analytics tool should make your job easier, not harder. Complex dashboards and confusing interfaces can slow you down and make it difficult to extract meaningful insights. UXCam stands out for its intuitive design and user-friendly dashboard, making it simple to track user behavior, analyze key metrics, and visualize data in just a few clicks. If you want to streamline your analytics process and focus on what matters most, UXCam is the tool to choose.
4. Request a demo or trial
Exploring different mobile app analytics tools is like test-driving cars to find your perfect match. Luckily, most providers offer free trials or demos, giving you the chance to take each one for a spin. Don't miss out on this opportunity to make sure the tool fits your needs and feels like a comfortable ride.
5. Check for integration capabilities
Simply put, compatibility is key. Consider your current tech stack and make sure the software you choose is in sync with your existing tools like CRM systems, marketing automation platforms, or app development frameworks. It's the little things that make a big difference!
6. Evaluate pricing and plans
Mobile app analytics software is typically offered in various pricing tiers or plans, with each level providing different features and benefits. Carefully evaluate each pricing plan to determine which one best fits your needs and budget. Keep in mind that some providers may charge extra for certain features, such as real-time data or custom event tracking, so it's crucial to read the fine print.
7. Examine the level of support offered
Have you thought about the level of customer support you'll receive when choosing an analytics software vendor? Top-notch providers are there for you through thick and thin with responsive and helpful service across various channels. Don't forget to peek into their resources, like how-to guides and webinars, to ensure you're maximizing the tool's potential.
By following these seven steps, you'll be well on your way to selecting the perfect mobile app analytics software for your app. Take your time, research your options, and remember to consider factors like UX, integration capabilities, and customer support. Happy hunting!
Optimize your app performance with UXCam
Choosing the right mobile analytics tool can be the difference between an app that struggles and one that thrives. With countless metrics to track and user behaviors to understand, the right insights empower you to build smoother, more engaging experiences that keep users coming back.
UXCam brings everything together in one intuitive platform, combining session replays, heatmaps, and funnel analytics to help you uncover what’s really happening inside your app. You’ll see exactly how users interact, identify friction points instantly, and make data-driven improvements with confidence.
Ready to see your app through your users’ eyes? Try UXCam for free today and turn every interaction into an opportunity for growth.
FAQ
What is mobile app analytics?
Mobile app analytics is the process of capturing, measuring, and analyzing user behavior data gathered from mobile platforms such as mobile phones, iPads, and mobile sites. The data is generated whenever users engage and interact with the mobile applications. The information collected can then be analyzed to measure how effective mobile platforms are in getting customers to complete an action.
Why are mobile app analytics important?
Without app analytics, you won’t know which features of your app are performing well and which are not. You’ll miss hidden opportunities and bottlenecks.
What are mobile app analytics tools?
A mobile app analytics tool is a software that helps you to monitor your app’s performance. Usually, these tools require the installation of an SDK (Software Development Kit) on your app.
What is the best mobile app analytics tools?
UXCam is the best mobile app analytics tool for teams that want to understand real user behavior across mobile and web apps. It combines session replay, heatmaps, and event-based analytics in one platform, giving teams a complete view of what users do and why they do it. With autocapture technology, UXCam automatically records every screen, tap, and gesture without manual tagging, making setup effortless for developers.
How do you use mobile app analytics tools?
Using mobile analytics tools involves several steps:
- Install the SDK: Add the analytics platform's code snippet to your app
- Configure tracking: Define events, screens, and user properties to track (some tools like UXCam autocapture this automatically)
- Collect data: Let the SDK gather information as users interact with your app
- Analyze insights: Review dashboards, funnels, and session replays to understand behavior
- Take action: Make product decisions based on data insights
- Measure impact: Track whether changes improve key metrics
The best approach combines both quantitative analytics (funnels, retention) and qualitative insights (session replay, heatmaps) to get the complete picture of user behavior.
What features should I look for in a mobile analytics tool?
Key features include session replay, heatmaps, funnels, retention tracking, segmentation, and integrations with your tech stack.
Are mobile analytics tools different from web analytics tools?
Yes. Mobile analytics tools are optimized for in-app behavior and device performance, while web analytics focus on website traffic and engagement. UXCam bridges both worlds by offering cross-platform analytics that help teams understand user interactions across mobile and web, all within a single intuitive platform.
You might also be interested in these articles:
Important mobile app analytics metrics to measure
Android Analytics: Top 8 Tools
Android Crash Reporting: Best Tools
iOS Crash Reporting: Best Tools
Mobile App Tracking: Best Tools
5 Best Session Replay Tools for Mobile Apps
Mobile Session Recording: The Complete Guide
Mobile App Heatmaps: Ultimate Guide 2026
Best 15 Heatmap Analysis Tool for Web and Mobile Apps in 2026


Related articles


Product Management
13 Best Product Management Tools 2026 & When to Use Them
Find out the top tools that the best product managers use daily to perform better at...


Jane Leung
Product Analytics Expert


Curated List
As 14 Melhores Ferramentas de Análise Web em 2026
Descubra as melhores ferramentas de análise web. Quer melhorar a experiência do usuário no seu site? Saiba quais são os recursos indispensáveis para uma análise web...

Jonas Kurzweg
Product Analytics Expert


Curated List
12 Best Customer Analytics Tools and Platforms 2026
In this article, we've compiled a list of customer analytics tools trusted by thousands of businesses worldwide and insights to help you select one that best suits your...


Tope Longe
Product Analytics Expert