8 Best UX Analytics Tools and Software We’ve Tested 2025

Quick summary
This article reviews eight leading UX analytics tools that help you understand how users interact with your website or app. It covers each tool’s overview, pricing, pros and cons, and practical ways to analyze user experience for better product performance. For more in-depth reviews, visit our blog.
Looking for the best tool to improve your product experience?
UX analytics tools reveal what traditional metrics can’t. They show where users struggle, what captures their attention, and what drives them to act. These tools combine behavioral data with visual insights to help you understand real user behavior and create more engaging digital experiences.
And the payoff is clear: companies that invest in UX see a return of $100 for every $1 spent, making it one of the highest-ROI investments you can make.
In this UXCam article, we’ll review 8 top UX analytics tools that help you uncover user insights, optimize your design decisions, and deliver seamless, conversion-driven product experiences.
Why trust us?
At UXCam, we’ve helped leading product teams around the world understand their users and improve digital experiences through data-driven insights. Trusted by thousands of companies, our platform is built on years of expertise in UX analytics, making us a credible and experienced guide to the best tools for optimizing user experience.


What are UX analytics tools?
UX analytics tools help you understand how people actually use your product. They track actions like clicks, scrolls, and navigation paths to reveal friction points or confusing layouts that affect user experience.
These tools go beyond surface metrics. They combine data from heatmaps, session recordings, and funnels to show how design choices impact engagement, conversion, and retention. This results in clearer insights to create smoother, more effective user experiences.
Why are UX Analytics tools important?
User behavior insights: Shows exactly how people interact with your product, highlighting what works and where they get stuck.
Data-driven decisions: Provides data-driven insights, helping teams make confident design and product decisions.
Improved usability: Guides continuous improvement by turning behavior data into clear, actionable design updates.
Enhanced engagement: Identifies friction points and helps create smoother user journeys that keep people coming back.
Optimized conversion: Pinpoints drop-off areas so you can optimize pages and features that drive results.
What are the best analytics tools?
Here's a list of the top UX analytics tools we’ll cover:
UXCam
Amplitude
Adobe Analytics
Mixpanel
Hotjar
Maze
Mouseflow
Lookback
Here’s also a quick comparison of the tools:
| Tool | Pricing | Platform Supported | Best For |
|---|---|---|---|
| UXCam | Custom pricing (free forever plan available) | Web platforms and mobile apps | Cross-platform product analytics combining session replay, heatmaps, and AI-driven insights |
| Amplitude | Free plan; paid plans start at $49/month | Mobile app and web platforms | Event-based tracking and quantitative insights for measuring user behavior |
| Adobe Analytics | Custom enterprise pricing | Mobile app and web platforms | Large-scale data tracking and attribution modeling across multiple digital channels |
| Mixpanel | Starts at $0.28 per 1000 events (free and custom plans also available) | Mobile apps and web platforms | Real-time event tracking and retention reporting with customizable dashboards |
| Hotjar | Free plan; paid plans start at $49/month | Web platforms | Simple heatmaps and session recordings for website behavior analysis |
| Maze | Free plan; paid plans start at $99/month | Mobile app and web platforms | Quick prototype testing and user feedback for early design validation |
| Mouseflow | Free plan; paid plans start at $39/month | Mobile apps and web platforms | Heatmaps and funnel analysis for improving website usability |
| Lookback | Paid plans start at $299/month | Mobile app and web platforms | Remote usability testing and live observation for qualitative research |
1. UXCam


Pricing: Custom pricing
Free trial: Free-forever plan + 14-day free trial for paid plans
Support for: Web platforms and mobile apps
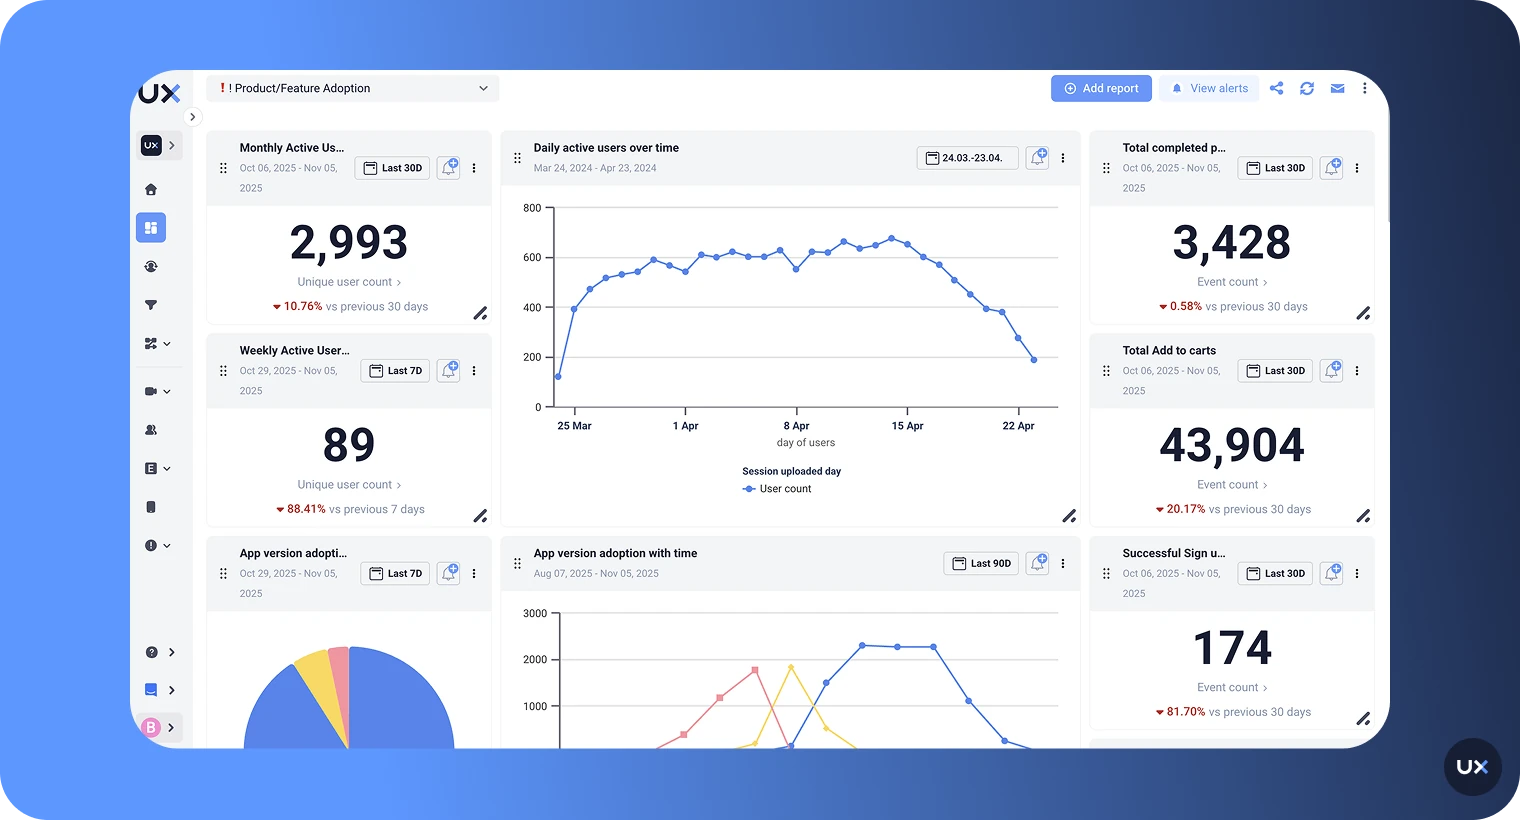
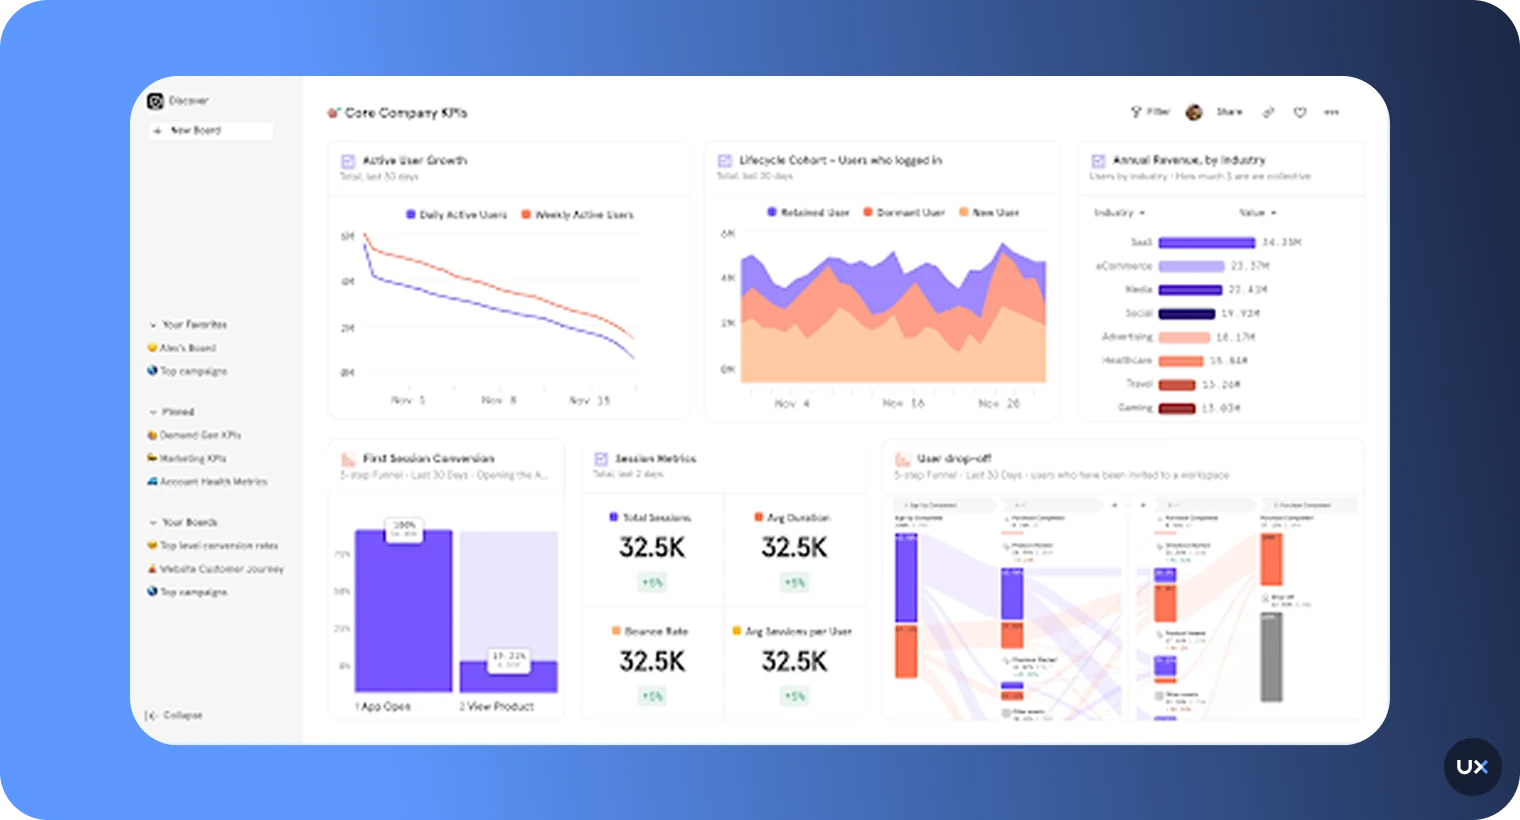
UXCam is a comprehensive product analytics platform built to help teams understand exactly how users interact with their web and mobile apps. It captures every tap, gesture, and screen flow through session replays, heatmaps, and event analytics, giving a complete view of the user journey.
With AI-powered insights, our platform automatically highlights friction points, usability issues, and opportunities for improvement. This allows teams to make data-driven design decisions, enhance product performance, and deliver experiences that truly meet user expectations.
How to analyze UX with UXCam
UXCam helps product teams understand how users truly experience their app by combining visual insights with behavioral data. Once the lightweight SDK is installed, UXCam automatically records user sessions, gestures, and screen transitions, capturing every interaction in real time without extra manual setup.
You can watch session replays to see exactly where users hesitate, get stuck, or abandon a flow. Heatmaps highlight the areas that attract the most attention or clicks, helping you identify which screens need design adjustments. Event analytics and funnels allow you to track key user actions, measure conversions, and uncover points of friction across the user journey.
By blending qualitative insights with quantitative data, UXCam provides a complete view of user behavior. This enables product and design teams to diagnose issues faster, make data-backed improvements, and deliver smoother, more intuitive user experiences that increase engagement and retention.
Features
Session replay: With UXCam, you can replay session recordings and analyze them using user frustration signals. The tool lets you apply advanced filters to recordings or segment them by events, such as UI freezes, rage taps, and crashes.
Event analytics: UXCam provides detailed event analytics. With this feature, you can measure the performance of your product and use event-based funnels to get qualitative insights.
Heatmaps: UXCam’s heat maps show you user behavior on every screen. You can use the info from the heat maps to fix design bottlenecks on your platform.
Issue analytics: UXCam lets you export technical logs and resolve UI freezes. You can also identify bugs and crashes on your mobile or web app.
Screen flow analytics: UXCam gives a complete overview of user screen flow. You can use this feature to build app flows that guide users on their journey.
If you have questions about UXCam, request a 1:1 demo.
Pros
Comprehensive session recordings and replay to visualize user interactions and diagnose UX problems quickly.
Lightweight SDK starts autocapturing screens, events & gestures with minimal manual tagging.
Combines quantitative metrics and qualitative insights, allowing teams to see what users do and understand why, all within one platform.
Tara, AI Analyst for identify friction points, usability issues, and user frustration signals by watching sessions for you.
Advanced filters and segmentation to analyze specific user groups, behaviors, and device characteristics.
Works for both web and mobile platforms, giving a full product-view.
Cons
Fewer customization options in the free plan
Does not currently offer built-in user feedback polls for direct customer input
2. Amplitude


Pricing: Paid plan starts at $49 per month
Free trial: Free plan with basic analytics
Support for: Mobile app and web platforms
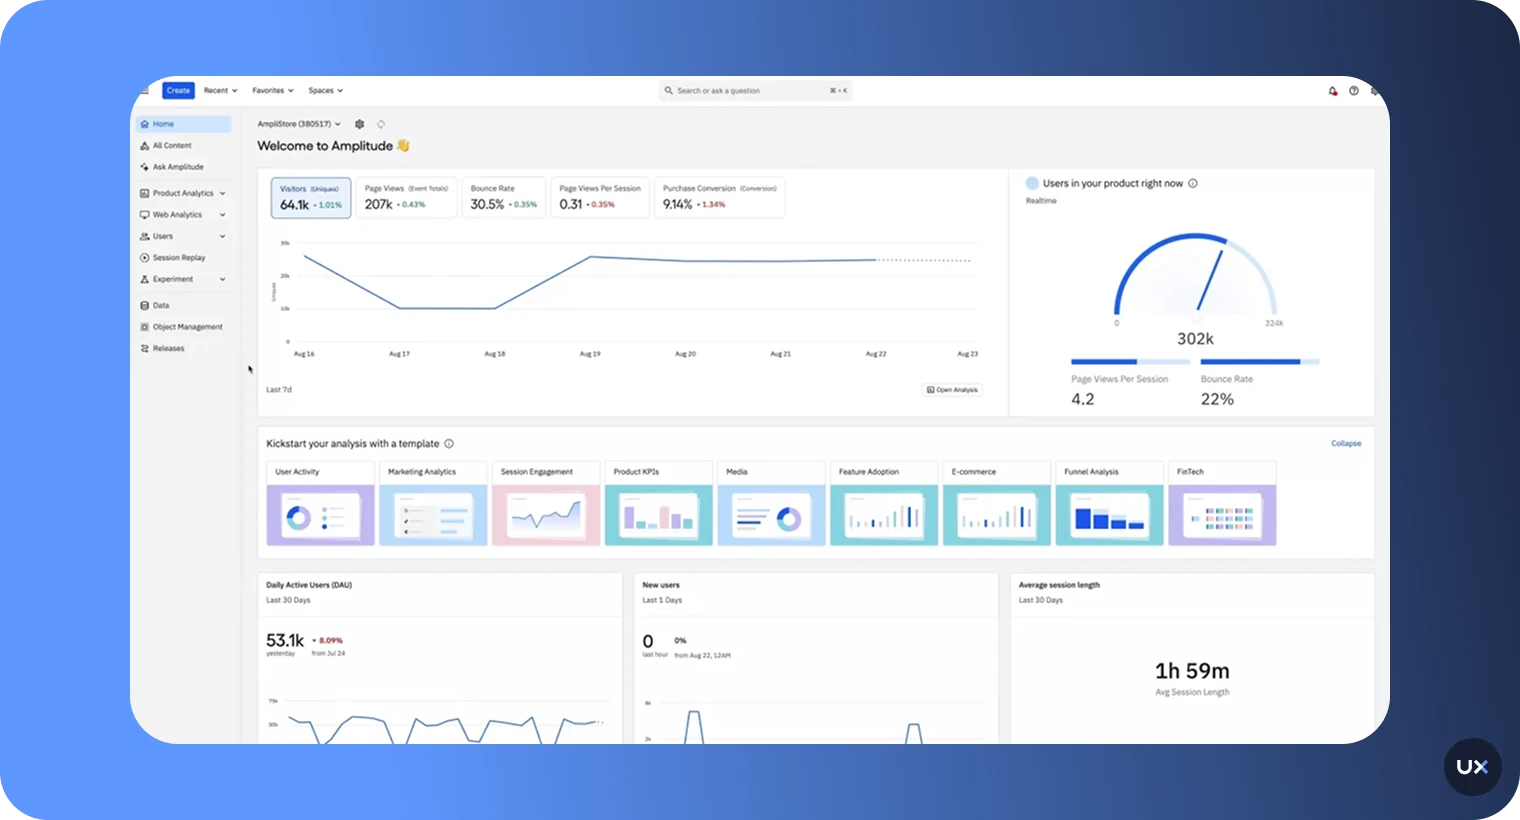
Amplitude is a digital analytics platform that helps you measure, understand, and improve user engagement across web, mobile, and other channels. It provides key insights into how users interact with your product, including how they navigate, where they drop off, and what actions they take.
How to analyze UX with Amplitude
Amplitude helps analyze user experience (UX) by providing insights into how users interact with a product or website. It tracks user behavior such as clicks, page views, and events, and allows for the creation of custom events to track specific actions within the product.
This data can then be analyzed to identify patterns and trends in user behavior, such as which features are most popular, where users are dropping off, and what actions are leading to conversions.
With this information, UX designers and product managers can make informed decisions about how to improve the user experience and optimize the product for increased conversions.
Features
Behavioral analytics: The Amplitude platform gives you the ability to segment users and track their behavior over time.
Collaboration tools: You can include team members from the product, marketing, and engineering to collaborate on insights.
Bi-directional connection: The tool gives you a bi-directional connection with the data you’ve collected. This means you can enrich your data warehouse, resolve customer identities, and perform self-service analytics.
Pros
Deep event-based tracking that uncovers how users move through the product.
Flexible segmentation and cohort analysis for spotting engagement patterns.
Clean, easy-to-read reports for quick overviews.
Cons
Setup and tagging can be complex and require engineering input.
Session replay and qualitative features are often limited compared to specialized UX tools.
3. Adobe Analytics


Pricing: Upon consultation
Free trial: None
Support for: Mobile app and web platforms
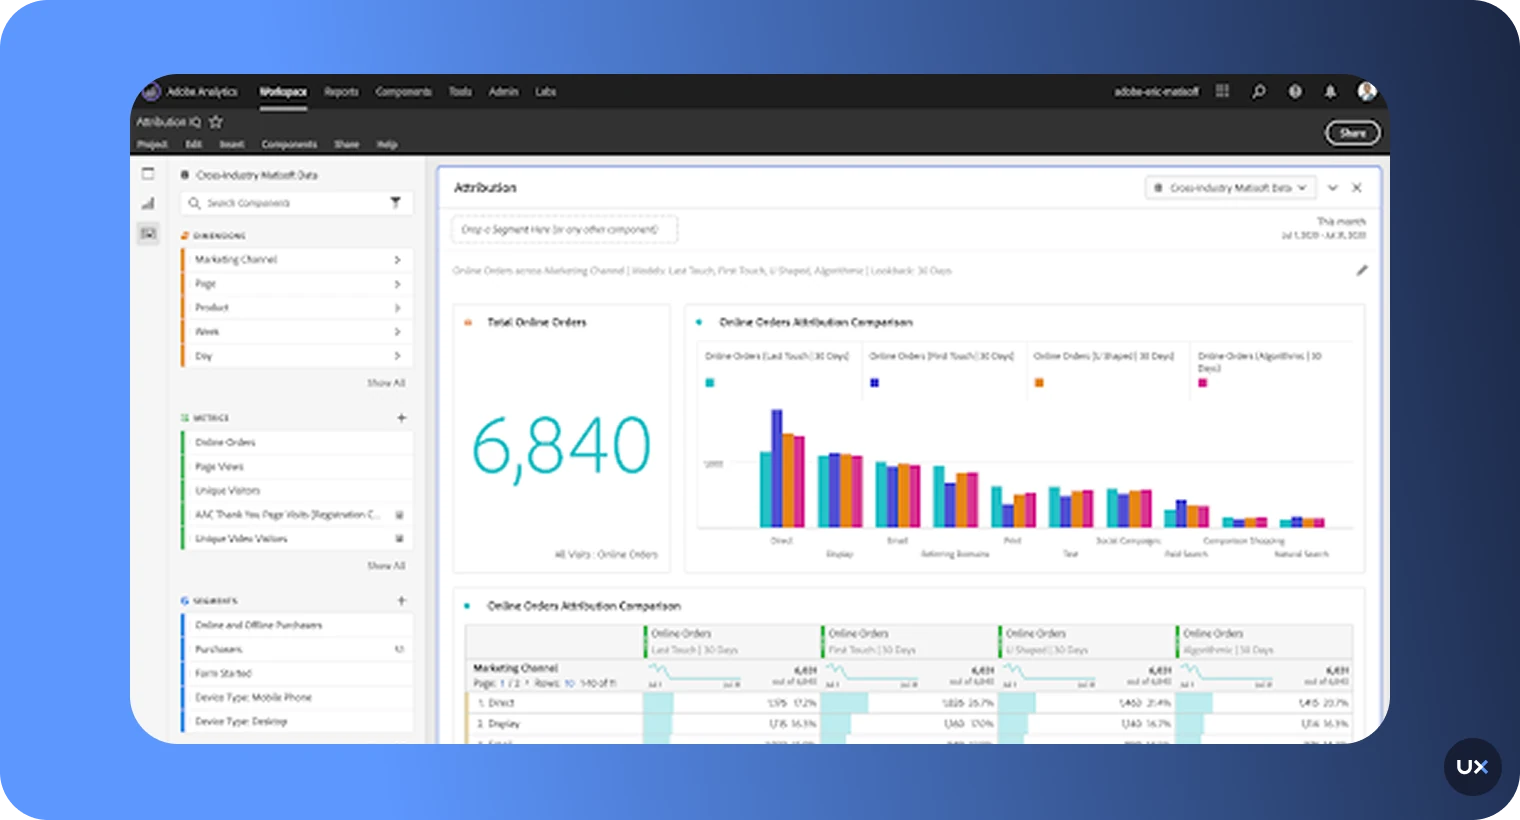
Powered by Adobe, this analytics platform focuses mainly on quantitative analytics. Adobe Analytics offers a suite of tools that you can use to make predictions about your users' future behavior. The platform works across multiple digital channels, so you can see all your data under a single platform.
How to analyze UX with Adobe Analytics
Adobe Analytics can be used to analyze user experience (UX) by providing insights into how users interact with a website or digital product. It allows for the tracking of website traffic, user behavior, and conversions, and provides detailed reports on key metrics such as page views, bounce rate, and conversion rate.
Additionally, Adobe Analytics allows for the creation of custom segments, which can be used to segment users based on specific criteria such as behavior, demographics, or location. This allows for a more granular analysis of user behavior, making it possible to identify patterns and trends in user behavior, such as which pages or features are most popular, where users are dropping off, and what actions are leading to conversions.
With this information, UX designers and product managers can make informed decisions about how to improve the user experience and optimize the website or digital product for maximum engagement and conversion.
Features
Multi-channel analysis: Adobe Analytics allows you to analyze data across all channels, including web and mobile apps.
Data visualization: It provides various charts and graphs to help you visualize user data.
Machine learning and AI: Adobe Analytics uses machine learning and AI to facilitate predictive analytics. For instance, it can rely on user behavior and data to predict future outcomes.
Pros
Broad data collection across web and mobile for traffic insights.
Integrates with other Adobe products for unified reporting.
Custom dashboards for campaign and audience tracking.
High degree of control over data and reporting suited for large enterprises.
Cons
Premium pricing and no free version make it less suitable for smaller businesses.
Best value tends to come when used within the full Adobe ecosystem, which may limit flexibility.
4. Mixpanel


Pricing: Starts at $0.28 per 1000 events (free and custom plans also available)
Free trial: None, but offers a free plan
Support for: Mobile apps and web platforms
Mixpanel is a powerful analytics tool you can use to retain and engage users with A/B testing. Trusted by more than 7,000 customers, including Buzzfeed, Uber, and GoDaddy, Mixpanel lets you build retroactive funnels. You can use them to analyze conversion rates, measure user engagement, and understand how users interact with your product.
How to analyze UX with Mixpanel
Mixpanel allows the user to create funnels, which can be used to track the user journey through different stages of the product, identify drop-off points, and optimize the user flow. This can be helpful for identifying and resolving issues related to navigation, interface design, and overall usability.
Mixpanel also allows for the creation of custom segments, which can be used to segment users based on specific criteria such as behavior, demographics, or location. This allows for a more granular analysis of user behavior and can help to identify patterns and trends in user behavior. This can lead to increased user engagement, retention, and ultimately better conversions for the product.
Features
Core reports: You can get core reports, including retention, funnels, flows, and insights.
Advanced analysis: The tool lets you analyze the impact of future launches on user behavior. Likewise, you can find statistically significant segments in your user base or see how experiments impact your metrics.
Query-time data modeling: Mixpanel lets you leverage query-time data modeling without any engineering resources.
Pros
Advanced event-tracking that helps you follow specific user actions and flows.
Customizable dashboards for visualizing engagement trends.
Real-time data tracking for quantitative metrics.
Cons
Setup and event-planning require engineering involvement, which can slow the start.
The cost rises sharply when event volumes or advanced features increase.
5. Hotjar


Pricing: Offers a Free Forever plan. Paid plan starts at $49 monthly
Free trial: 15 days
Support for: Web platforms
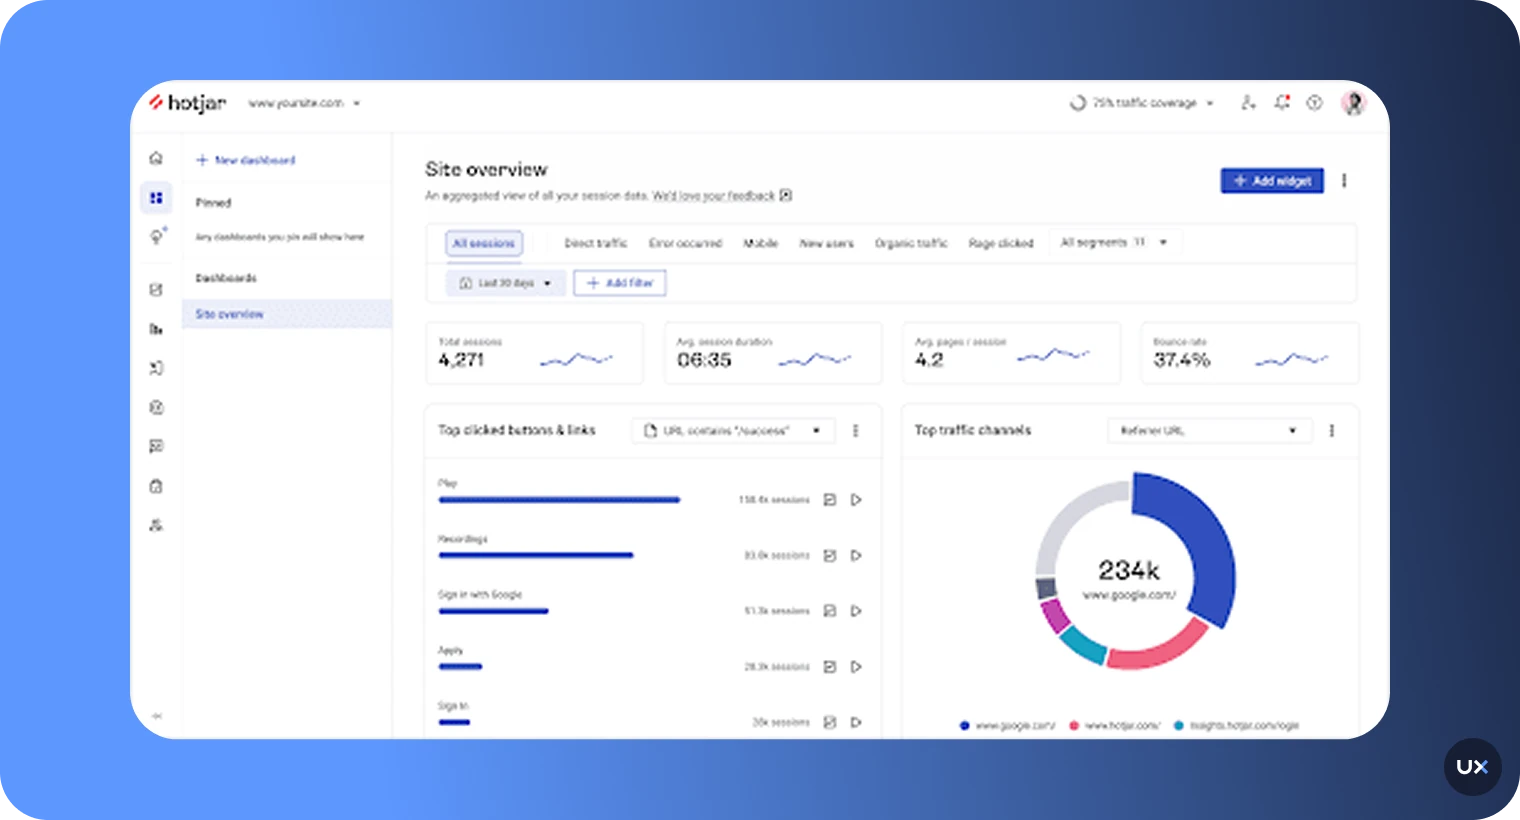
Hotjar is another well-known UX analytics tool that’s popular for its session recordings and heatmaps. You can also use its user feedback widgets to get actual insight from your users rather than guessing what they want.
How to analyze UX with Hotjar
One of the key features of Hotjar is its ability to provide visual data such as heatmaps and session recordings. This can help product managers understand how users interact with the product, where they click, scroll, and hover on the website or mobile application. This can be especially helpful for identifying and resolving issues related to navigation, interface design, and overall usability.
Hotjar also allows for the creation of surveys, which can be used to gather user feedback, understand user's needs and how they perceive the product. This can be incredibly useful for making data-driven decisions about how to improve the user experience.
Additionally, Hotjar allows for the creation of custom segments, which can be used to segment users based on specific criteria such as behavior, demographics, or location. This allows for a more granular analysis of user behavior and can help to identify patterns and trends in user behavior. This can lead to increased user engagement, retention, and ultimately better conversions for the product.
Features
Survey templates: You can use Hotjar's survey templates to create surveys about user experience and make changes to your platform accordingly.
Session recordings: Watch a user's session live or replay it later with your product manager and UX design teams. You can also narrow down the recordings by referrers, u-turns, and rage clicks.
Save filter combinations: Hotjar lets you save your filter combinations as segments. So, you can come back to them whenever you need to, especially when working toward recurring goals.
Pros
Easy-to-use heatmaps and session recordings that make user paths visible.
Useful for quick visual feedback on page design.
Easy setup with limited technical requirements.
Cons
Some performance impact or setup complexity reported, especially during session recordings.
Feature limitations in comparison to full-scale analytics or product tools.
6. Maze


Pricing: Starts at $99/month
Free trial: Free plan with basic analytics
Support for: Mobile app and web platforms
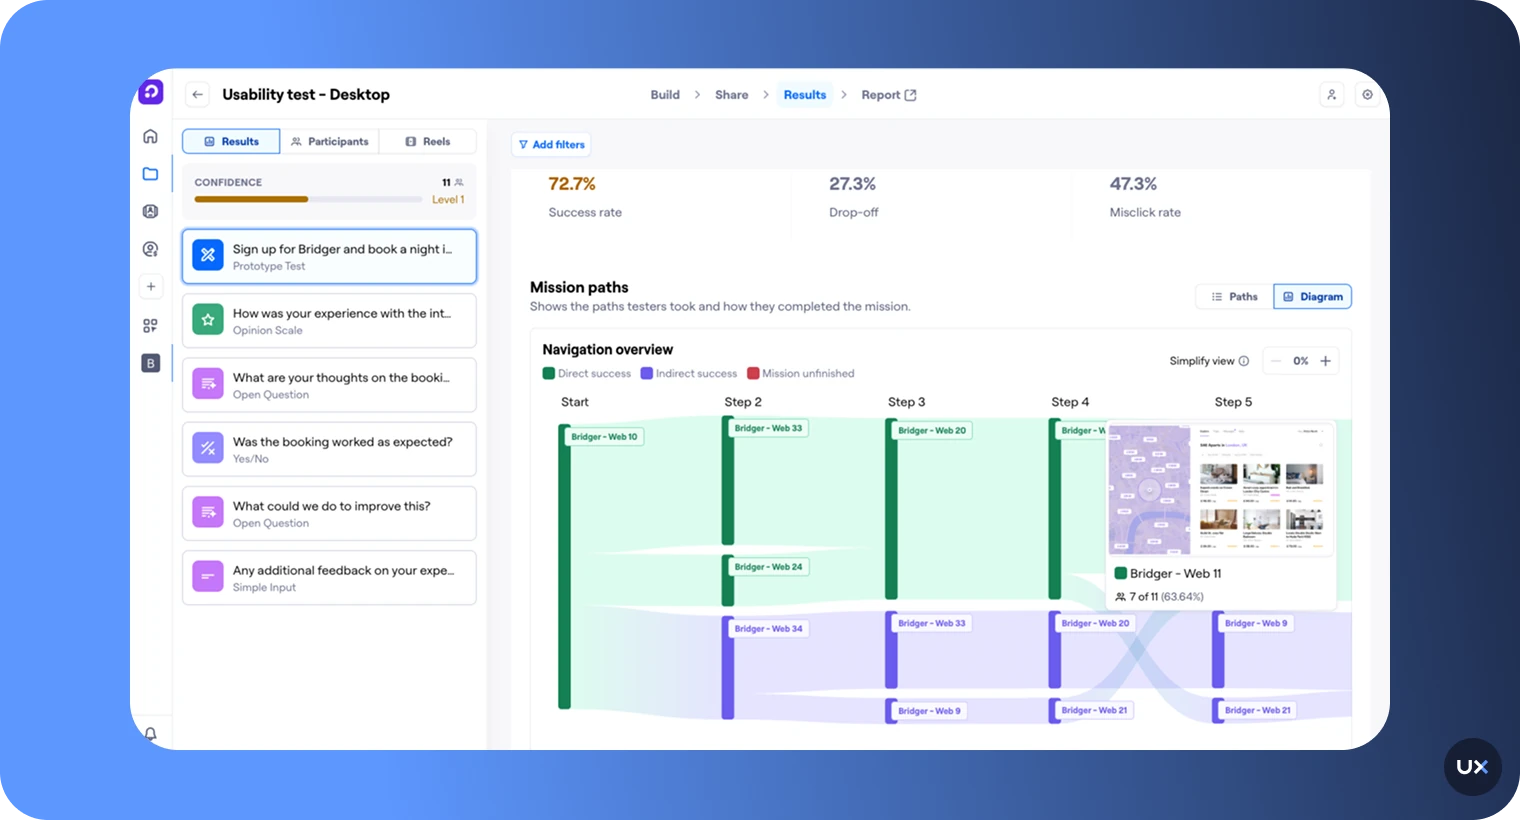
Maze is a user research platform that enables product and marketing teams to test different elements of user experience. It turns user feedback into actionable insights, providing rich visual data from heatmaps and mis-clicks to bounce rates. This helps teams to make decisions based on data, improve design metrics, and understand user behavior.
How to analyze UX with Maze
Analyzing UX with Maze is a systematic process involving organizing usability issues, conducting tests to understand user interactions, and integrating live website testing. The organized documentation of issues forms the foundation for actionable insights. Usability tests, leveraging Maze features, provide comprehensive data on user behavior.
Live website testing, specifying device types and defining paths, yields insights for refinement. Additionally, card sorting, documenting assumptions, and conducting tests contribute to understanding information architecture, with follow-up interviews for deeper insights.
The findings and insights are then incorporated into a comprehensive usability testing report, highlighting actionable recommendations for design enhancements.
Features
Prototype Testing: Maze enables prototype testing for insights into user behavior.
Feedback Surveys: Use Maze to collect user feedback and gain insights into their needs and preferences.
Interview Studies: Deepen your understanding of user behavior through insightful user interviews facilitated by Maze.
Pros
Intuitive interface and easy setup for surveys and prototype tests.
Supports a variety of research methods in one platform.
Good integration with design tools like Figma for streamlined workflows.
Cons
Occasional prototype crashes, especially on mobile devices, are reported.
Report customization and detailed filtering can be limited for heavy research needs.
7. Mouseflow


Pricing: Starts at $39 per month
Free trial: Free trial available
Support for: Mobile apps and web platforms
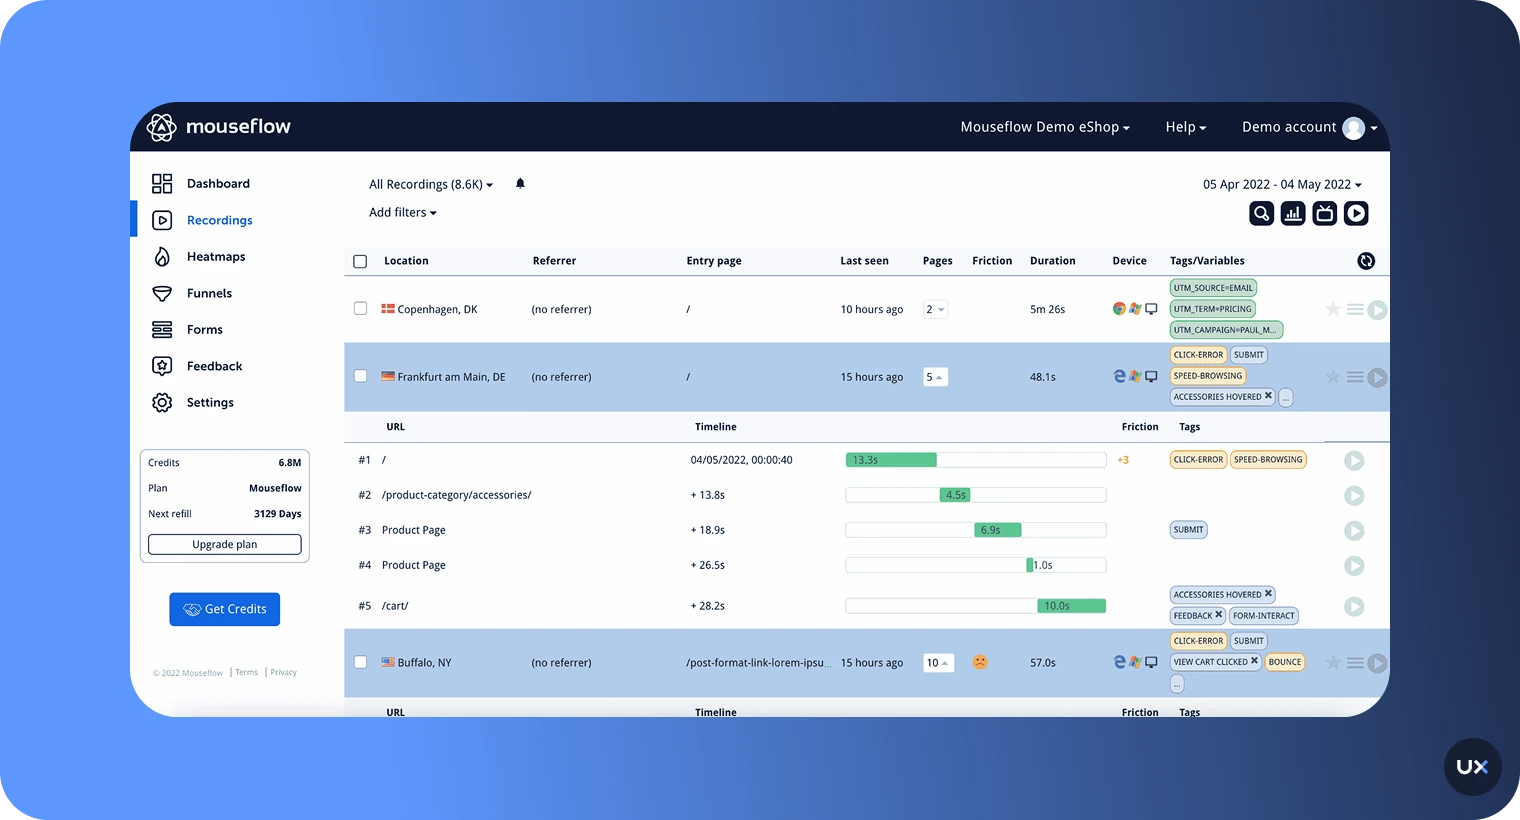
Mouseflow is a comprehensive behavioral analytics platform designed to enhance user experience and boost conversion rates on websites. With tools like session replay, heatmaps, and user feedback, Mouseflow allows you to analyze user behavior, identify pain points, and discover opportunities for improvement. If you have an Android app, you can leverage Mouseflow to track event data, and similarly, installing Mouseflow on your React app mirrors the process of installation on a website.
How to analyze UX with Mouseflow
The journey begins with Session Replay, where you can watch video recordings of user sessions. This feature allows you to gain a thorough understanding of the sequence of actions and events between your visitors' clicks, offering insights into navigation patterns and potential pain points.
Moving forward, Heatmaps provide a visual representation of user activity on all your pages. With the ability to automatically generate six types of heatmaps, you can understand what elements are capturing users' attention. This visual data becomes instrumental in making informed design decisions aimed at enhancing user engagement and satisfaction.
Next in the analytical toolkit is the creation of Conversion Funnels within Mouseflow. This involves setting up and monitoring the progression of visitors through different stages on your website.
Features
Heatmaps: Automatically generate six types of heatmaps in Mouseflow to understand user attention on all pages.
Conversion funnels: Set up funnels in Mouseflow to monitor visitor progression and identify drop-off points on your website.
Form analytics: Improve lead generation by using Mouseflow's form analytics, gaining insights into user interactions with forms.
Pros
Easy setup and intuitive interface for heatmaps and session recordings.
Quick setup for small-scale analysis.
Provides conversion funnels and simple engagement tracking.
Cons
Some features (such as advanced funnels or integrations) are seen as limited or missing.
Loading issues or data accuracy concerns are reported especially with dynamic content.
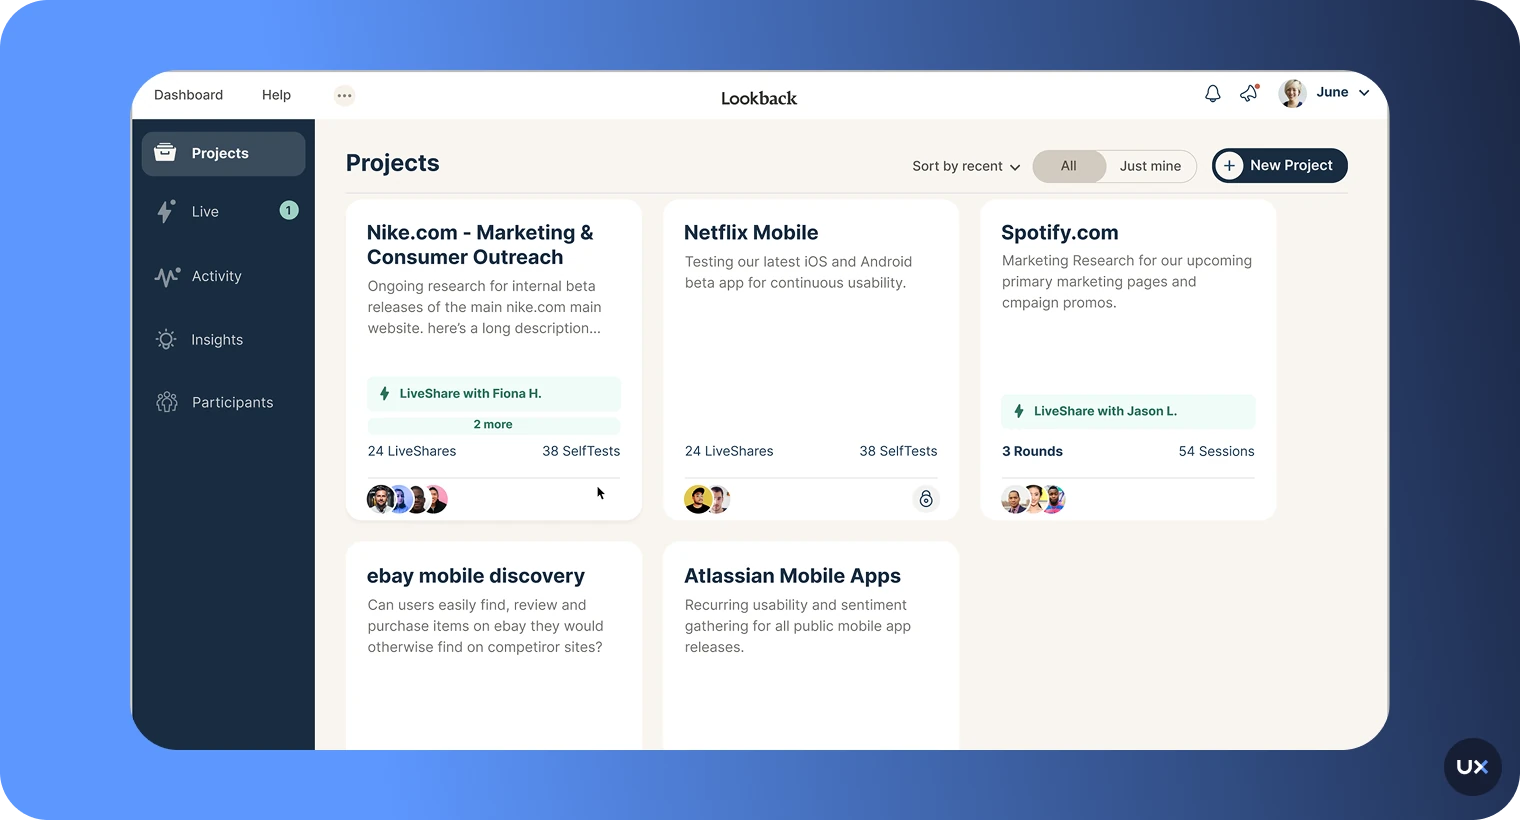
8. Lookback


Pricing: Starts at $299 per year
Free trial: Five free sessions
Support for: Mobile app and web platforms
Lookback is a UX research platform for user testing, usability studies, and more. Its features include video recording of user sessions and timestamped note-taking, which enable you to quickly identify areas where users are struggling and adjust your product accordingly. With Lookback's A/B testing tool, you can easily compare different versions of your website or app to determine which design is most effective for users.
How to analyze UX with Lookback
Lookback simplifies qualitative research with features like Observation Experience for top-tier participant interaction and usability testing, capturing complete customer experiences.
For qualitative interviews, Lookback excels in capturing nuanced details, offering transcriptions, and highlight reels. The tool provides unlimited seats and projects on every plan, fostering openness and accessibility throughout the organization.
Additionally, Lookback integrates seamlessly with participant recruiters like User Interviews and Respondent, supporting end-to-end research workflows.
Features
Usability Testing: Captures the full experience of your customer by recording their screen, voice, and expressions as they navigate your product.
Integration with Participant Recruiters: Supports end-to-end research workflows with participant recruiters, User Interviews and Respondent.
Eureka: Generate research summaries and pull out action items from lengthy sessions with AI.
Pros
Live observation and note-taking for moderated usability sessions.
Collaborative tools for teams running research studies.
Compatible with mobile and web usability testing.
Cons
No built-in participant recruitment pool.
Limited advanced analysis or built-in reporting features.
Enhance user experience with UXCam
The UX analytics tools in this guide can help you understand user behavior, improve design decisions, and create smoother digital experiences. While they all have their strengths, UXCam stands out with superior web and mobile analytics, visual context, and AI-driven insights.
Our platform captures every interaction and turns them into clear, actionable data. With session replays, heatmaps, and event analytics in one place, you can identify issues faster and design experiences users love.
Try UXCam for free today and start improving your user experience. You might also be interested in these;
Best behavioral analytics tools to optimize mobile app UX
Mobile UX design: The complete expert guide
20+ powerful UX statistics to impress stakeholders
Top mobile app analytics tools


Related articles


Product Management
12 Best Product Analytics Tools and Software 2026
Discover the top product analytics tools and learn how to extract valuable insights, optimize performance, and drive growth with these powerful...

Jonas Kurzweg
Product Analytics Expert


Curated List
7 Best AB Testing Tools for Mobile Apps
Learn with examples how qualitative tools like funnel analysis, heat maps, and session replays complement quantitative...


Jane Leung
Product Analytics Expert


Tool Comparisons
UXCam vs Amplitude: A real comparison for mobile product analytics
Compare UXCam and Amplitude for mobile product analytics. See where event-based metrics work, where they fall short, and how UXCam's AI-powered product analytics platform reveals what's actually happening in your...


Begüm Aykut
Growth Marketing Manager