Back to blog
17 MIN READ
What is Mobile Analytics? Guide, Tools & Best Practices
PUBLISHED
4 November, 2025


Product Analytics Expert


Quick summary
The mobile app market is more competitive than ever, and understanding how users interact with your app is key to standing out. Without mobile analytics, improving performance and user experience becomes guesswork. This guide explains what mobile analytics is, why it matters, and how it helps product teams make data-driven decisions.
Understanding user behavior goes far beyond tracking downloads or counting sessions. Today’s users move seamlessly between web, mobile, and hybrid experiences, so your analytics need to capture that entire journey.
The best mobile analytics tools give you visibility into how real people use your product. They help you identify what’s working, where users get stuck, and which experiences drive retention or frustration.
In this article, we’ll break down what mobile analytics is, why it matters for your product’s success, and how to use it effectively to understand your users and optimize every part of their journey.
Why listen to us?
With 37,000+ products using UXCam in 50+ countries, we’ve helped brands like Costa Coffee, Housing.com, and PlaceMakers turn analytics into measurable growth. Our experience spans industries and product types, giving us a front-row view of how teams use analytics to drive engagement, reduce churn, and build better products.
What is mobile app analytics?
Mobile app analytics is a way to gather data from app users to show user behavior and track app performance. If you have questions about your users, you need to dive into analytics.
Mobile app analytics platforms are tools used to track, observe, and support the evaluation of user behavior and experience.
Here are some common situations for product managers where mobile app analytics can help uncover solutions:
Which screens are most engaged with, and where do users spend most of their time?
Are my users flowing through my app as intended, or are there areas of friction?
Which screens in my app have the highest crash rate?
What are the most common interactions (gestures) across my app?
Which features seem confusing to users?
These are just a few examples of the sort of data mobile teams gain access to with mobile app analytics. With this much detail on how users interact with your app, you can consistently improve the user experience and improve retention, engagement, and conversion rates.
Why is mobile analytics important?
On average, after downloading your app, only 13% of users will continue to engage with your app regularly or at all. Tracking app analytics is critical to figure out how users are interacting with your app, where they’re likely to drop off, and areas that are frustrating or confusing to users to improve your user engagement rates.
Making informed, data-driven decisions will lead you toward a more user-centered approach to product development. Let’s look at an example.
Costa Coffee had a goal of optimizing its app registration process to increase its user base and revenue through the app. Using UXCam, their analytics manager tracked custom events related to the registration metrics, then built a funnel. With this visualization, the team could see the way users were typically moving through the sign-up process.
This combination of custom events and funnels uncovered their biggest bottleneck: 15% of users dropped off after entering an invalid password. After looking into the specific session recordings for these users and noticing patterns, the team redesigned the sign-up flow, fixing the issue with incorrect password attempts.
If the mobile team at Costa Coffee didn’t have those granular insights, it would have been a lot more time-consuming to figure out the issue and potential solutions than by using quantitative methods.
Some more advantages of using an app analytics platform:
Gain data-driven insights. Apps with high retention rates usually experience better user engagement, which means more customers and revenue. Using an analytics tool to get this data frees up time for mobile teams to focus on delivering user-focused product updates.
Collect accurate data. Without performing or checking user feedback or interviews, app analytics platforms uncover the why behind user behavior and experience with detailed, reliable data.
Helps customize apps. Having this data means being able to easily identify issues through features like session replay and heatmaps to fix obstacles in the user journey. This way, product managers have the ability to customize the app and become closer to the goal of providing a seamless experience to end-users.
Aligns cross-functional teams. Being able to share session recordings, customizable dashboards, and crash reports means separate teams can quickly gain clarity on issues. For example, with UXCam, customer support teams can speak to a customer about an issue, review their session, and then share that session with the PM or engineering team to solve.
Measure and track KPIs. Dashboards make it possible to digest insights and confidently act on them while keeping track of overall app performance. A mobile app KPI dashboard is a convenient way to get an overview of key mobile analytics at a glance. For specific examples of buildable dashboards to track for product managers, engineers, and designers, read our in-depth KPI article.
What is the difference between web and mobile analytics?
There are many different ways to track product analytics, and it can be overwhelming to decide which approach would best suit your product and your team.
Web analytics is used to focus on metrics like page views, behavior-related metrics, patterns generated by user cohorts, interaction frequency, and user interactions with ads.
Mobile app analytics generate a higher amount of data and support product teams to understand user behavior. UXCam auto-captures user data, device data, and behavioral data, as well as issue and performance data.
Hybrid analytics allows product teams to, in theory, track data for both web products and mobile applications.
It’s especially important to track as much data as possible for mobile apps as they’re a little more complex than web pages. Mobile apps have multiple versions live across different devices for different app versions, whereas websites have one version. Because of this, PMs are often left with having to understand users across multiple platforms, versions, and device types. This means that specific, in-depth tooling solutions are required.
The question is: how do you quantify and understand user engagement? The days of simple demographic segmentation are over. Users in completely different age groups can have very similar behavior when it comes to mobile apps. For this, you’ll need to invest in mobile app analytics that dives into the mobile app KPIs and metrics that matter most for your business.
Key mobile analytics metrics to track
To succeed in mobile analytics, you need to focus on several essential metrics. Some top mobile analytics KPIs to track are;
Downloads & Installs: Track how many users download and install your app. This gives you an idea of your app's initial appeal.
Daily Active Users (DAU): Monitor how many users engage with your app daily to gauge its regular usage.
Monthly Active Users (MAU): Measure the number of users active within a month to understand your app's broader user base.
Session Length: Look at how long users spend in your app per session to assess engagement levels.
Retention Rate: Calculate the percentage of users who return to your app over time to determine its stickiness.
Conversion Rate: Analyze how effectively your app converts users into paying customers or achieves other key actions.
Customer Lifetime Value (CLV): Estimate the total revenue you can expect from a user throughout their relationship with your app.
Average Revenue Per User (ARPU): Track the average revenue generated per user to understand the financial performance of your app.
Dive deeper into 50+ top mobile analytics kpis and metrics to track and measure
Top mobile analytics tools
Choosing the right mobile app analytics tools is crucial for gaining valuable insights and optimizing your app’s performance. Here are some of the top tools you should consider:
1. UXCam
UXCam is a leading product and UX analytics platform built for mobile, web, and hybrid applications. It helps product teams visualize user behavior through session replays, heatmaps, funnels, and event analytics; all in one place. Designed for all team sizes, UXCam provides an in-depth view of user journeys, making it easy to identify friction points, improve UX, and boost retention.


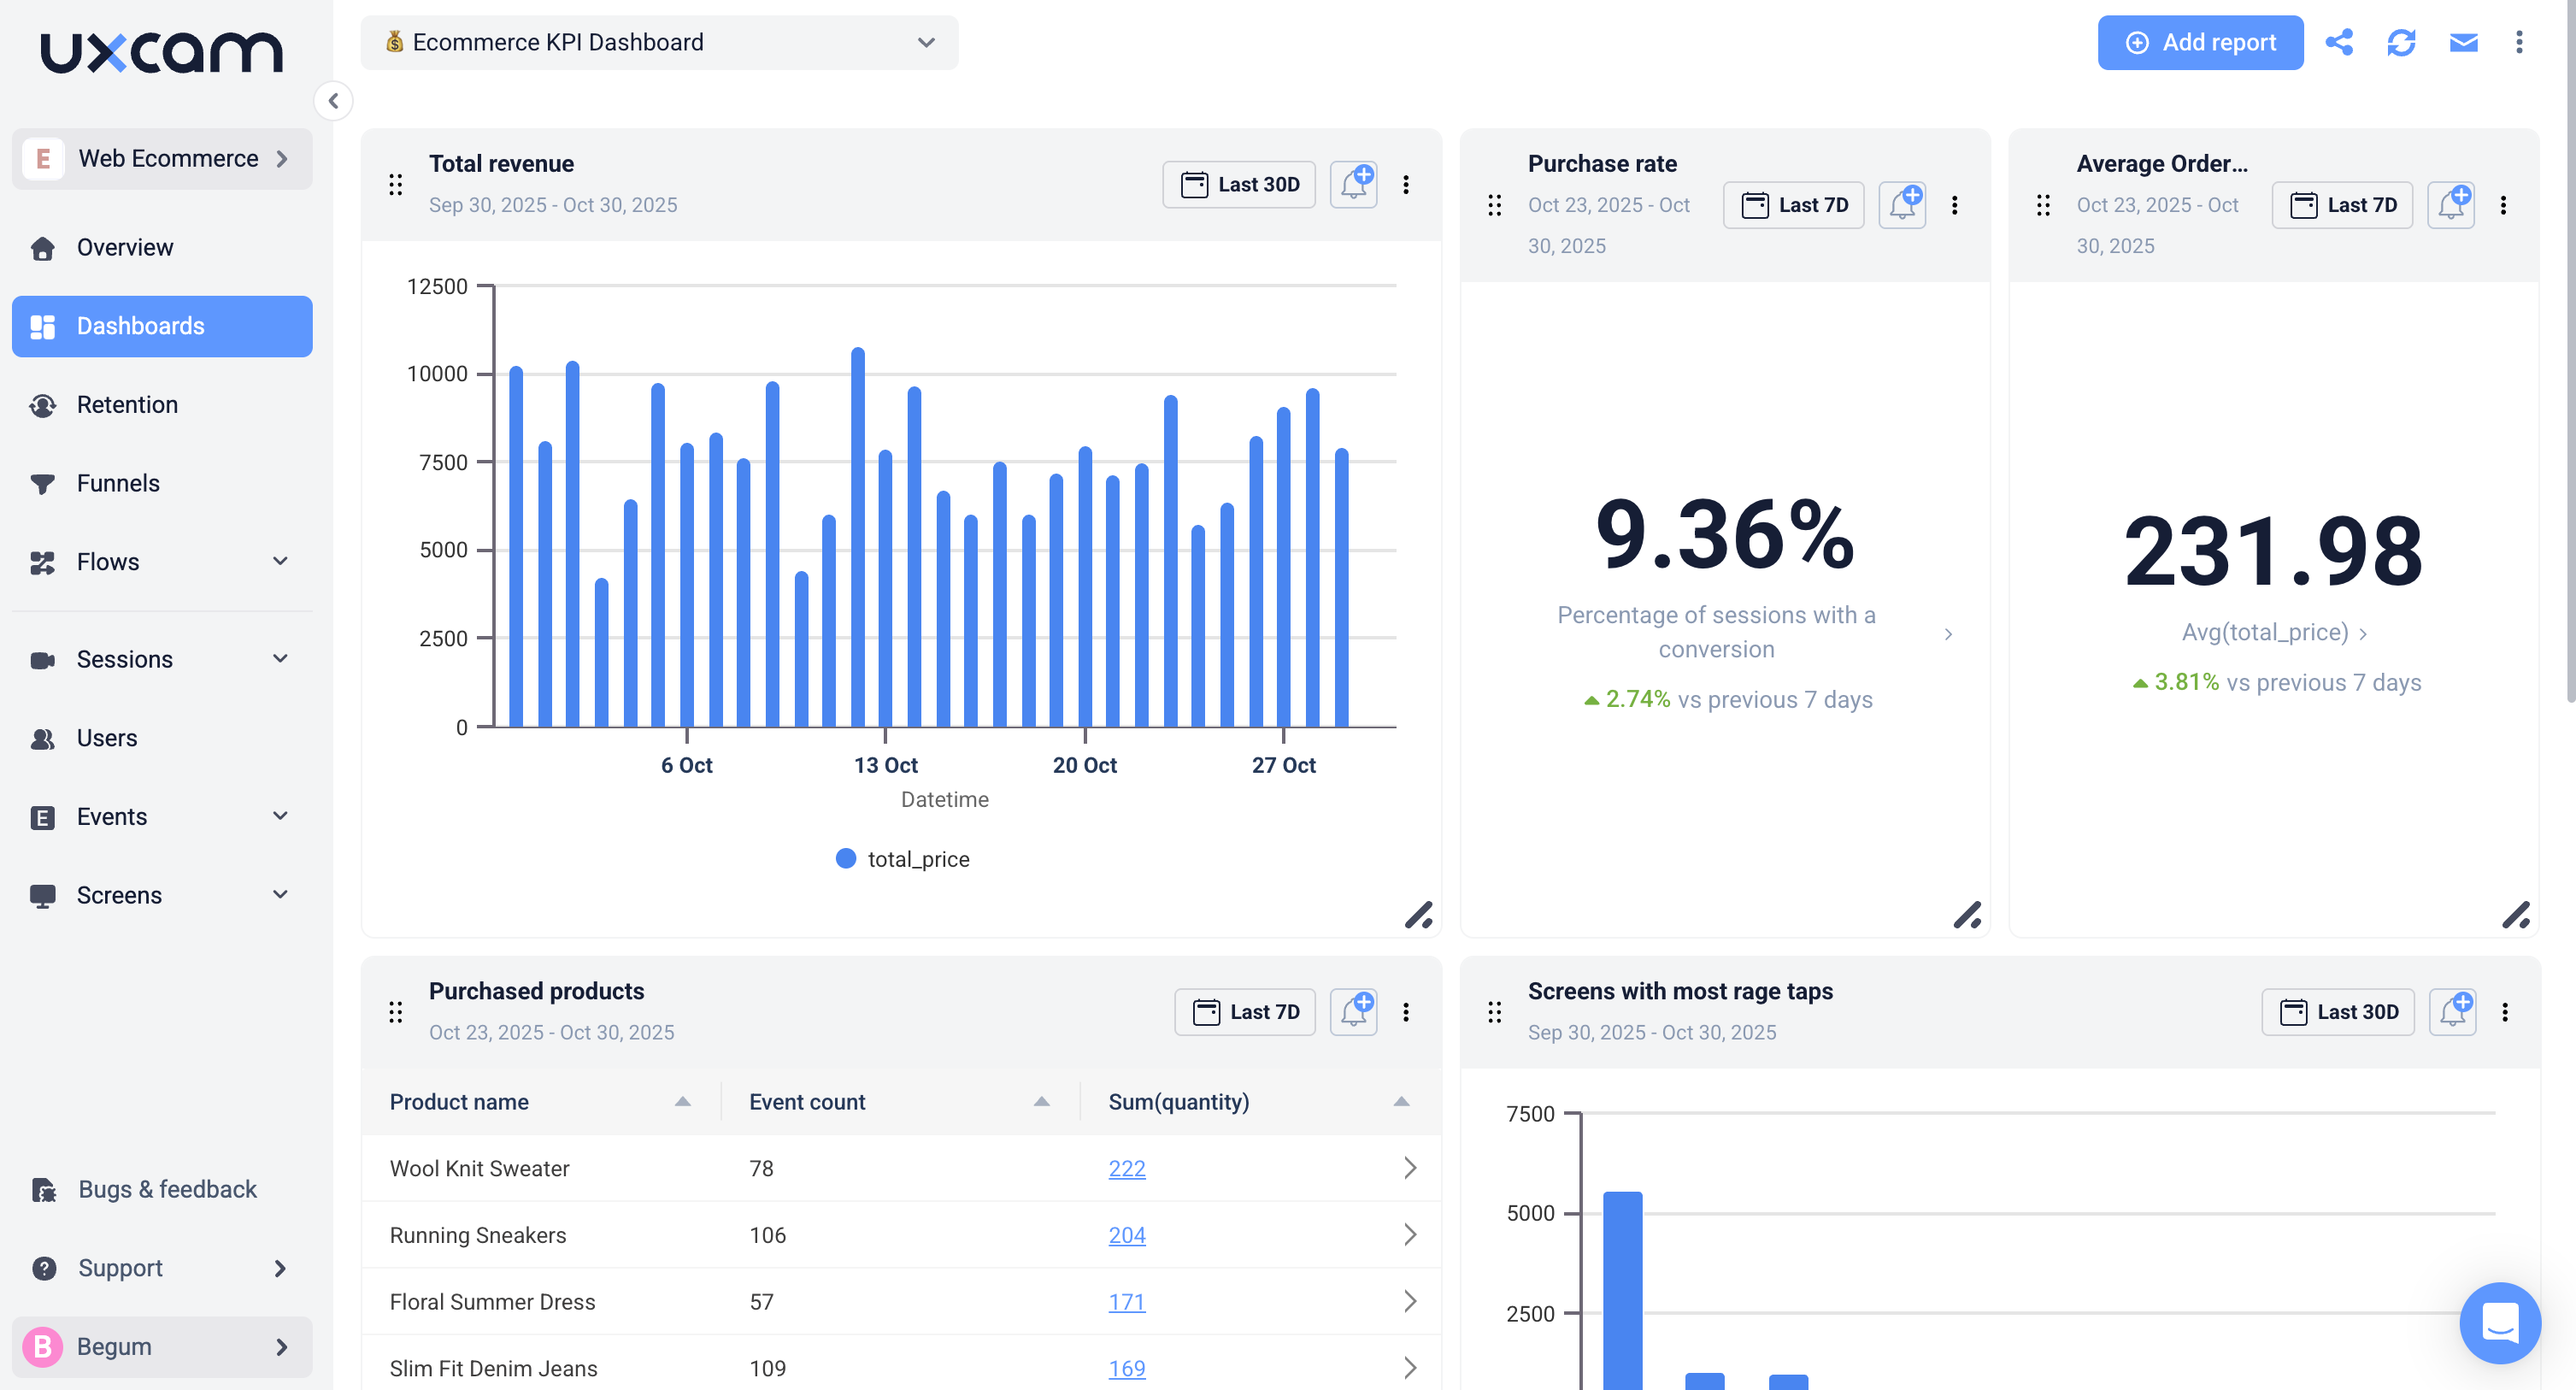
Key features
Cross-platform analytics: Track user behavior seamlessly across web, mobile, and hybrid products in one unified dashboard.
Session replay: Watch real user sessions to understand how users navigate, struggle, and convert.
Heatmaps (Mobile & Web): Visualize touch, click, and scroll behavior to spot engagement hotspots and usability issues.
Tara AI (AI product analyst): Get instant summaries and insight suggestions from AI to accelerate data-driven decisions.
Autocapture technology: Capture every interaction automatically, no manual event setup required.
Funnel & Retention analysis: Identify where users drop off and measure the impact of UX changes on long-term engagement.
Privacy-first design: Complies with GDPR, CCPA, and HIPAA; includes screen blurring, element masking, and data anonymization.
Integrations: Connect easily with tools like Segment, Amplitude, or data warehouses for advanced data workflows.
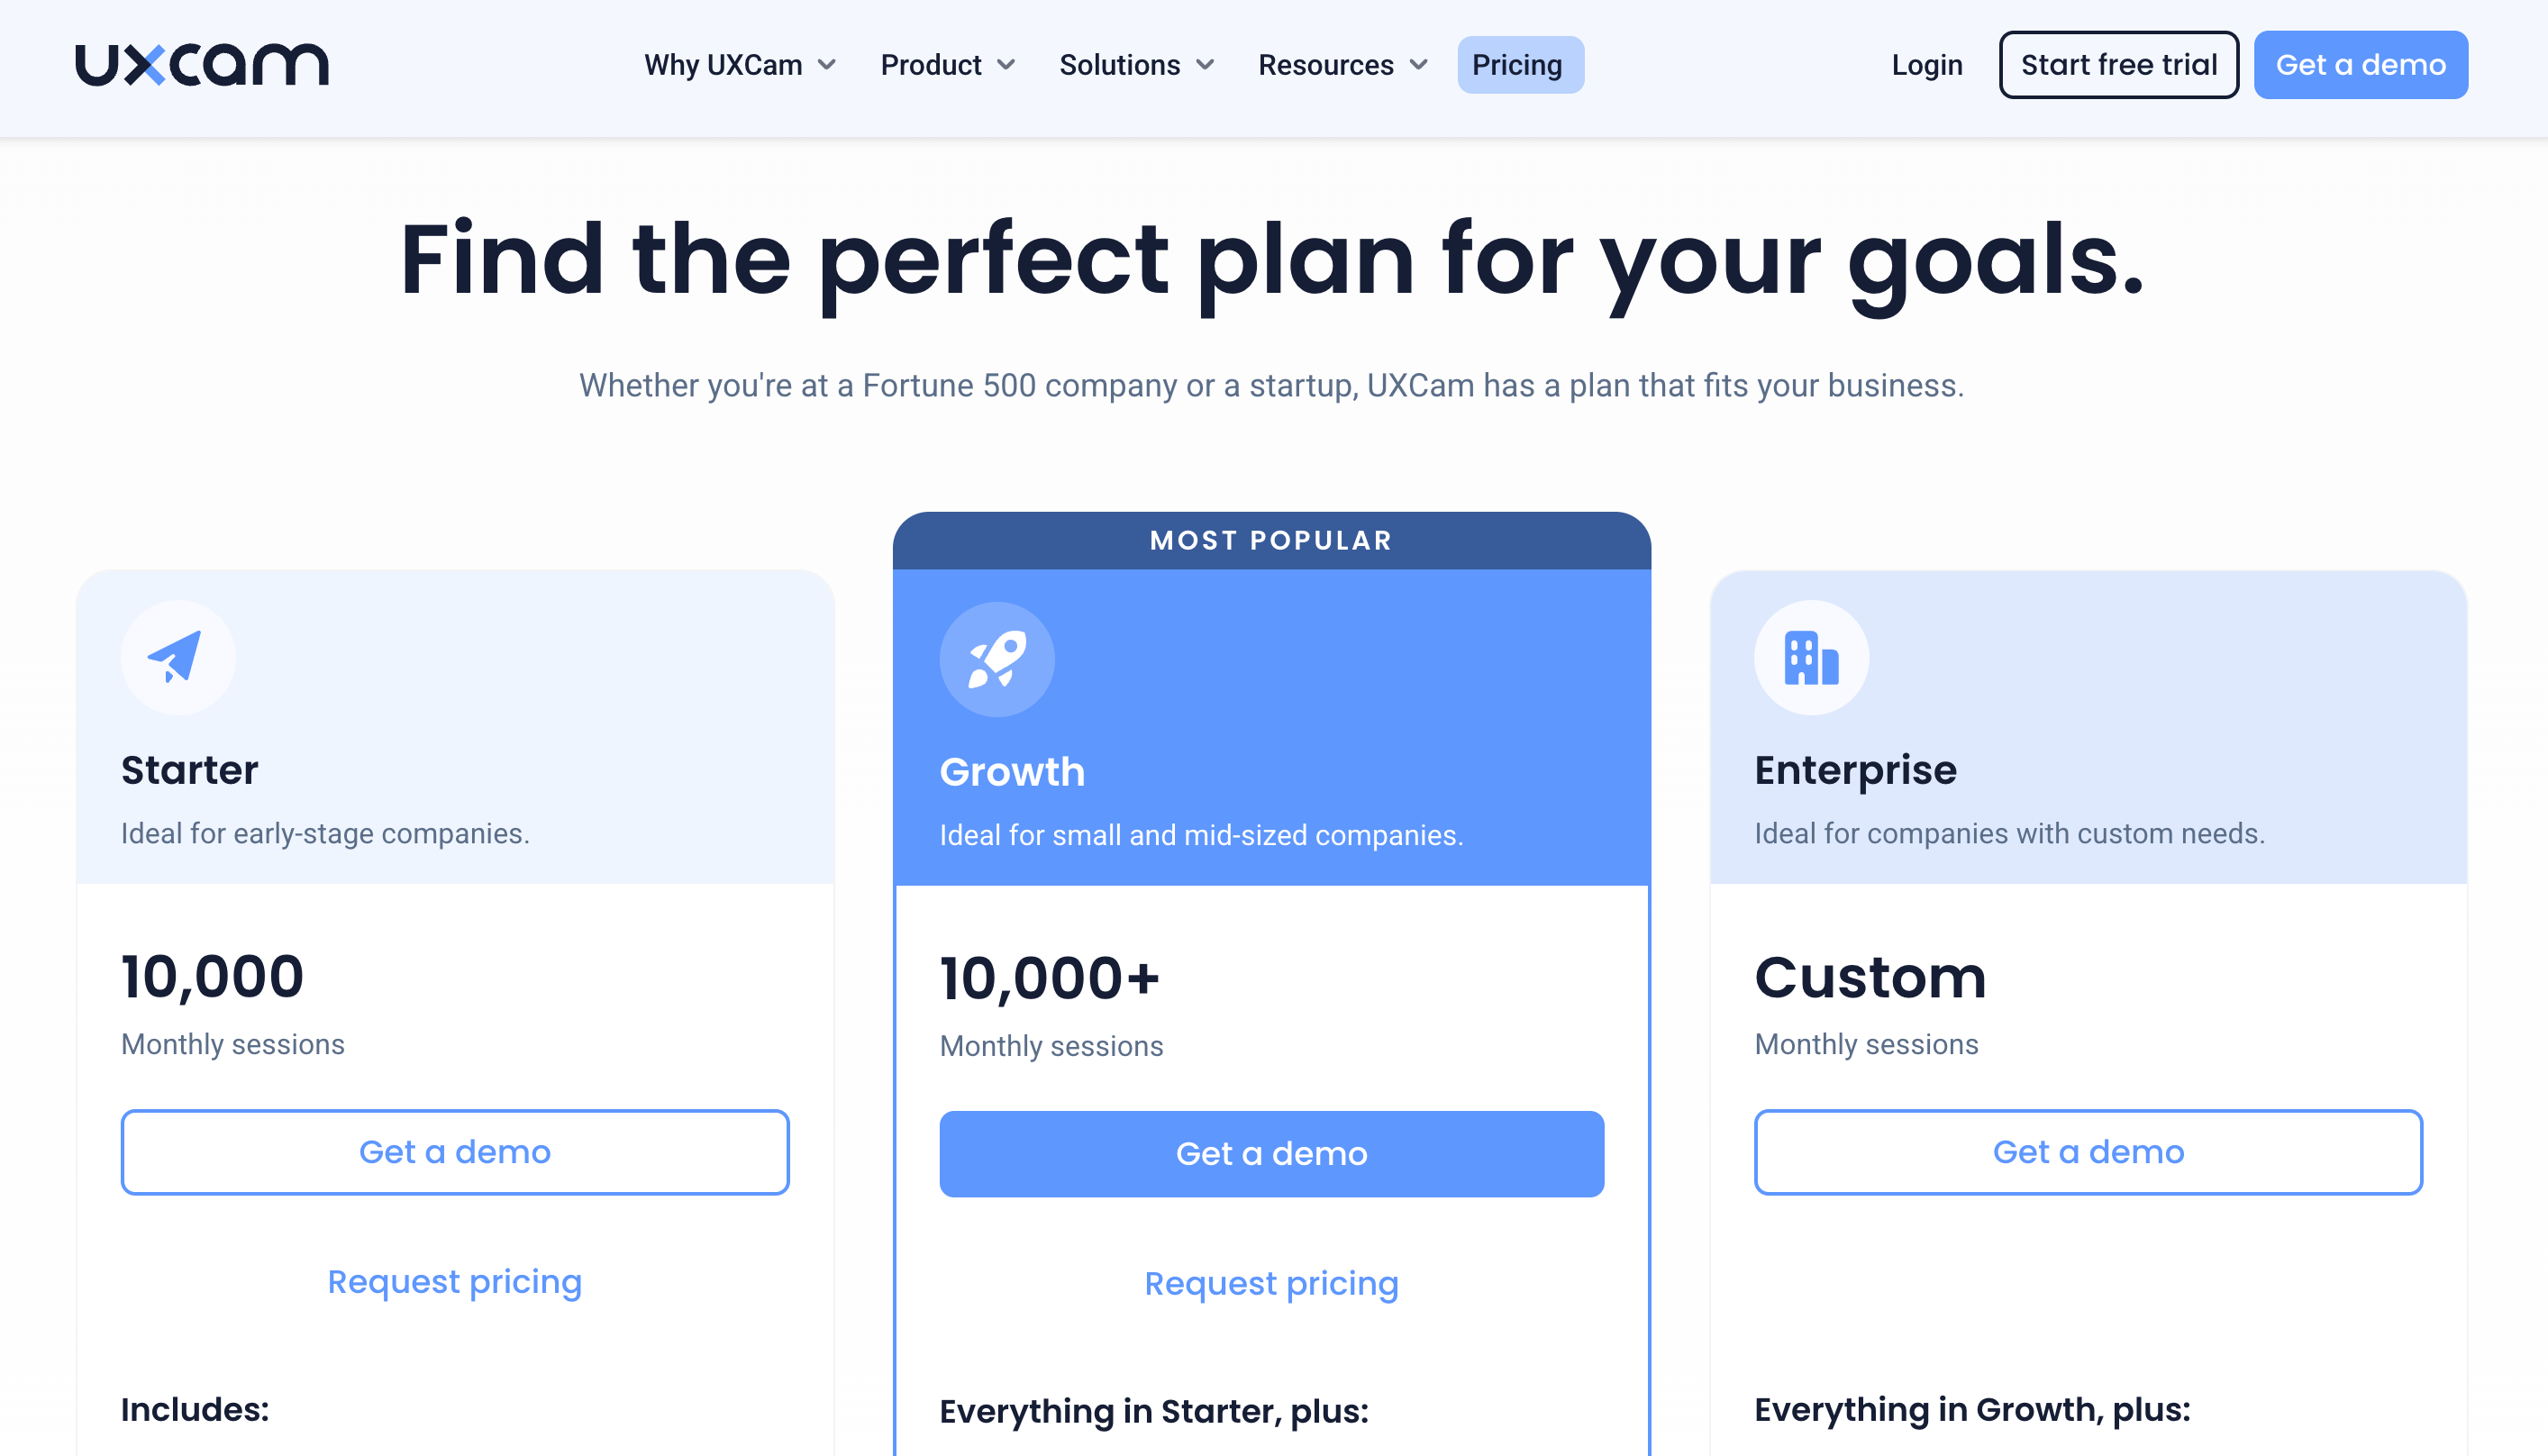
Pricing
UXCam offers custom pricing tailored to the scale and specific needs of each product. You can start with a free trial to explore its capabilities or contact the sales team for enterprise solutions.


Pros
Comprehensive analytics for both mobile and web in one platform.
Autocapture setup saves engineering time.
Tara AI delivers rapid, actionable insights.
Robust privacy and data protection standards.
Excellent support and onboarding for enterprise teams.
Cons
Advanced features may require onboarding to fully leverage.
2. Google Analytics for Firebase
Google Analytics for Firebase is a free analytics tool designed for developers and product teams who want to understand how users interact with their mobile and web apps. Fully integrated with the Google ecosystem, it provides a solid foundation for tracking user engagement, app performance, and marketing effectiveness.


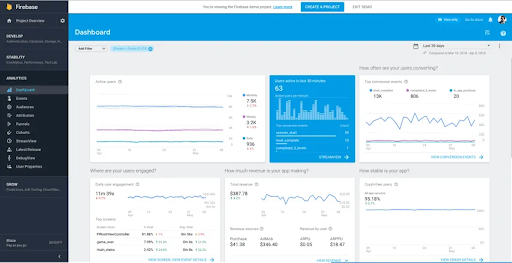
Key features
Real-time analytics: Monitor user activity and app performance as it happens.
Event-based tracking: Automatically tracks key user events such as installs, in-app purchases, and screen views.
User segmentation: Create dynamic audience segments to personalize campaigns or product updates.
Integration with Google stack: Works seamlessly with Google Ads, BigQuery, and Cloud Messaging.
Attribution tracking: Measure the effectiveness of marketing channels and user acquisition sources.
Pricing
Firebase Analytics is free to use, with no limits on core event tracking or user reporting. But it adopts a pay-as-you-go pricing model.
Pros
100% free and easy to integrate into mobile or web projects.
Excellent for quantitative data and real-time performance tracking.
Tight integration with the Google ecosystem for marketing attribution.
Strong developer documentation and community support.
Reliable infrastructure and high data accuracy.
Cons
Lacks qualitative tools like heatmaps or session replays.
Can be complex for non-technical teams to navigate.
Limited flexibility in customizing events beyond the Google ecosystem.
Data retention policies are less flexible than enterprise tools like UXCam.
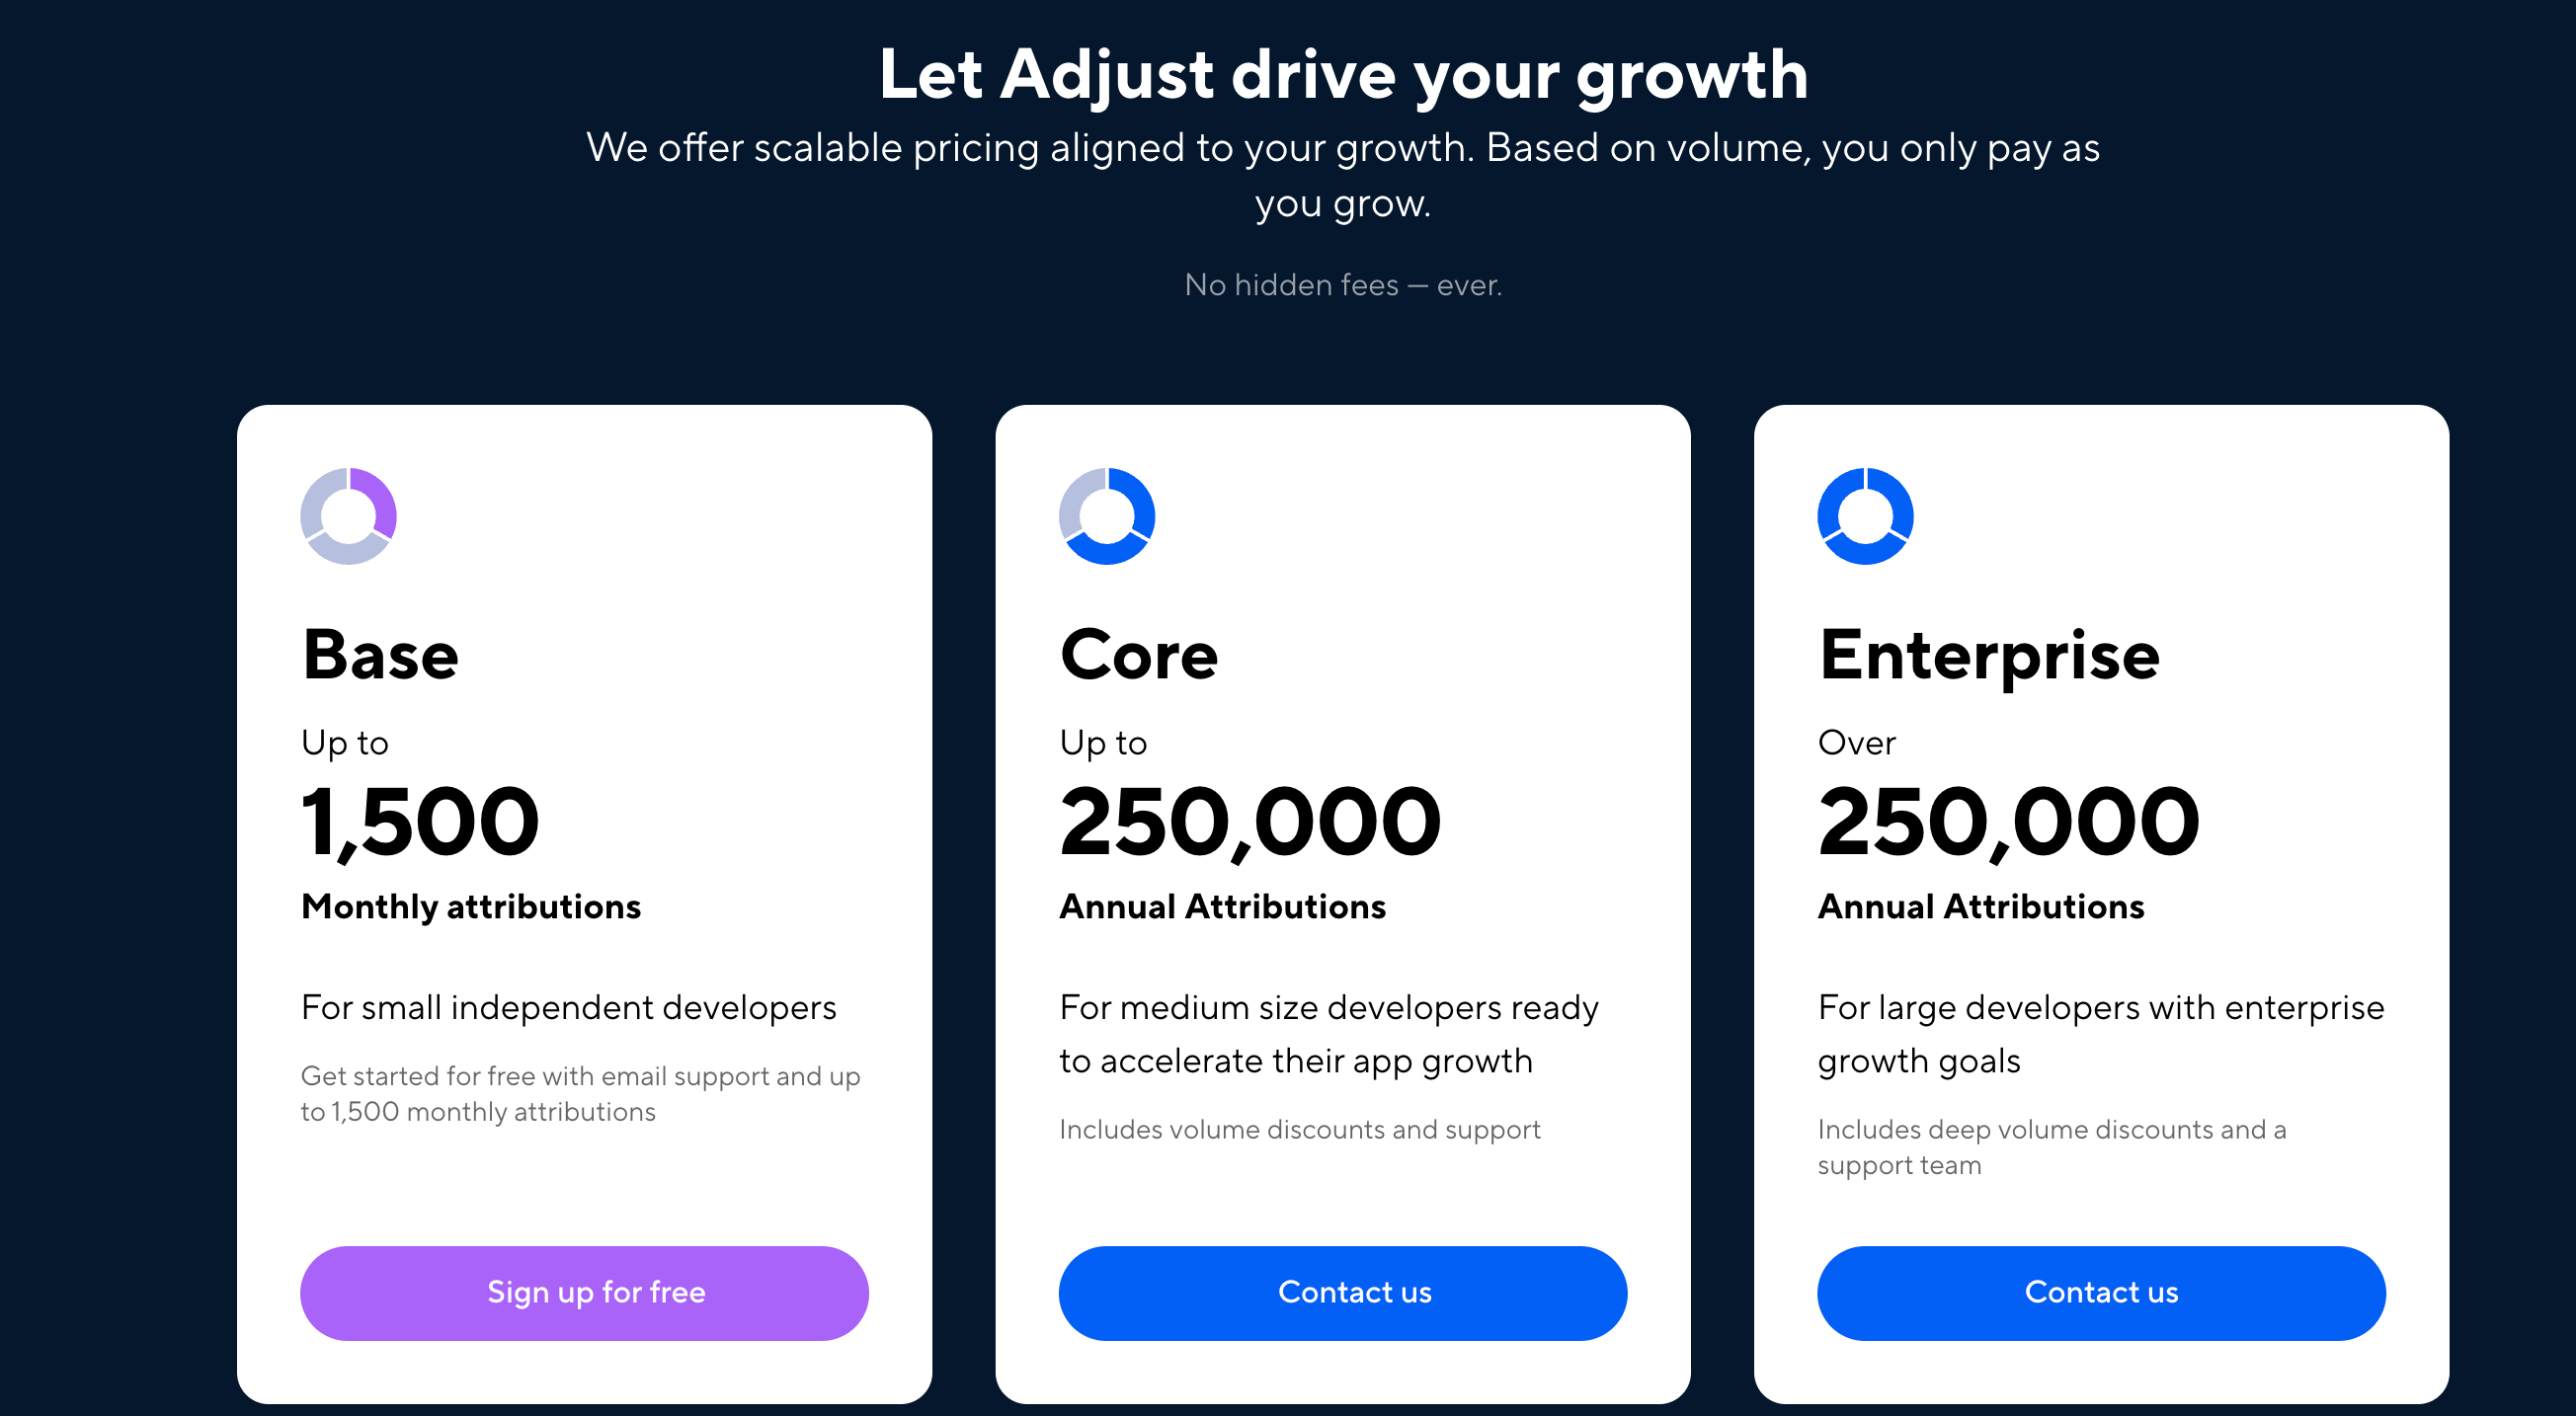
3. Adjust
Adjust is a mobile analytics and attribution platform built for marketing teams that need to track campaign performance and measure ROI across multiple channels. It’s designed to help brands understand where users come from, how they engage after installation, and which campaigns drive the highest-value customers.


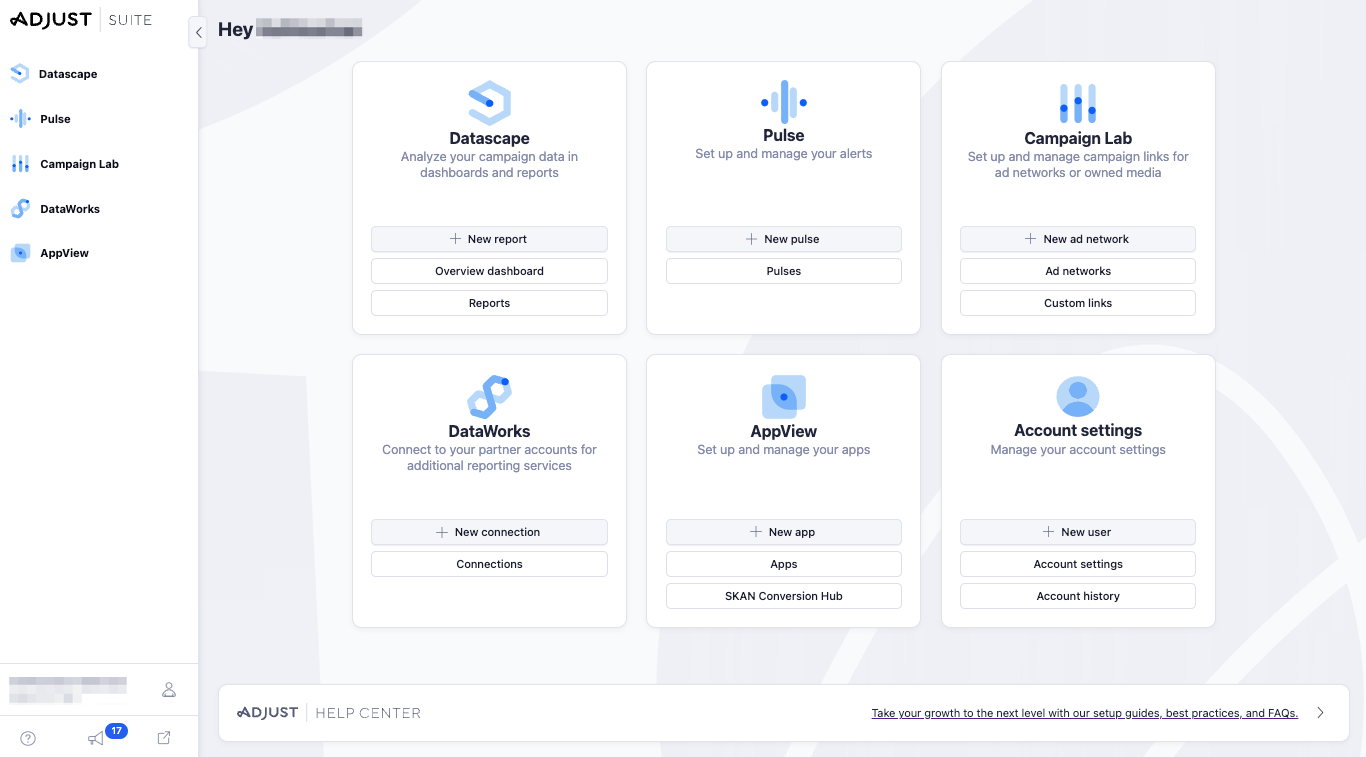
Key features
Attribution tracking: Identify where your installs and conversions come from—ads, social media, or organic traffic.
Fraud prevention suite: Protect ad budgets with built-in click and install fraud detection.
Cohort analysis: Group users by campaign source or behavior to measure long-term engagement.
Audience builder: Create dynamic user segments for targeted re-engagement.
Integration with ad partners: Works seamlessly with over 2,000 ad networks and data tools.
Pricing
Adjust uses custom pricing based on app volume, campaign activity, and feature selection. Pricing details are available on request.


Pros
Excellent attribution accuracy across ad networks.
Strong fraud prevention and security features.
Ideal for measuring ROI and campaign performance.
Scalable for global marketing operations.
Offers cohort and audience analytics for retargeting.
Cons
Focused primarily on marketing, not product or UX analytics.
Limited visualization of in-app behavior.
Requires manual integration for advanced features.
Steeper learning curve for non-marketing users.
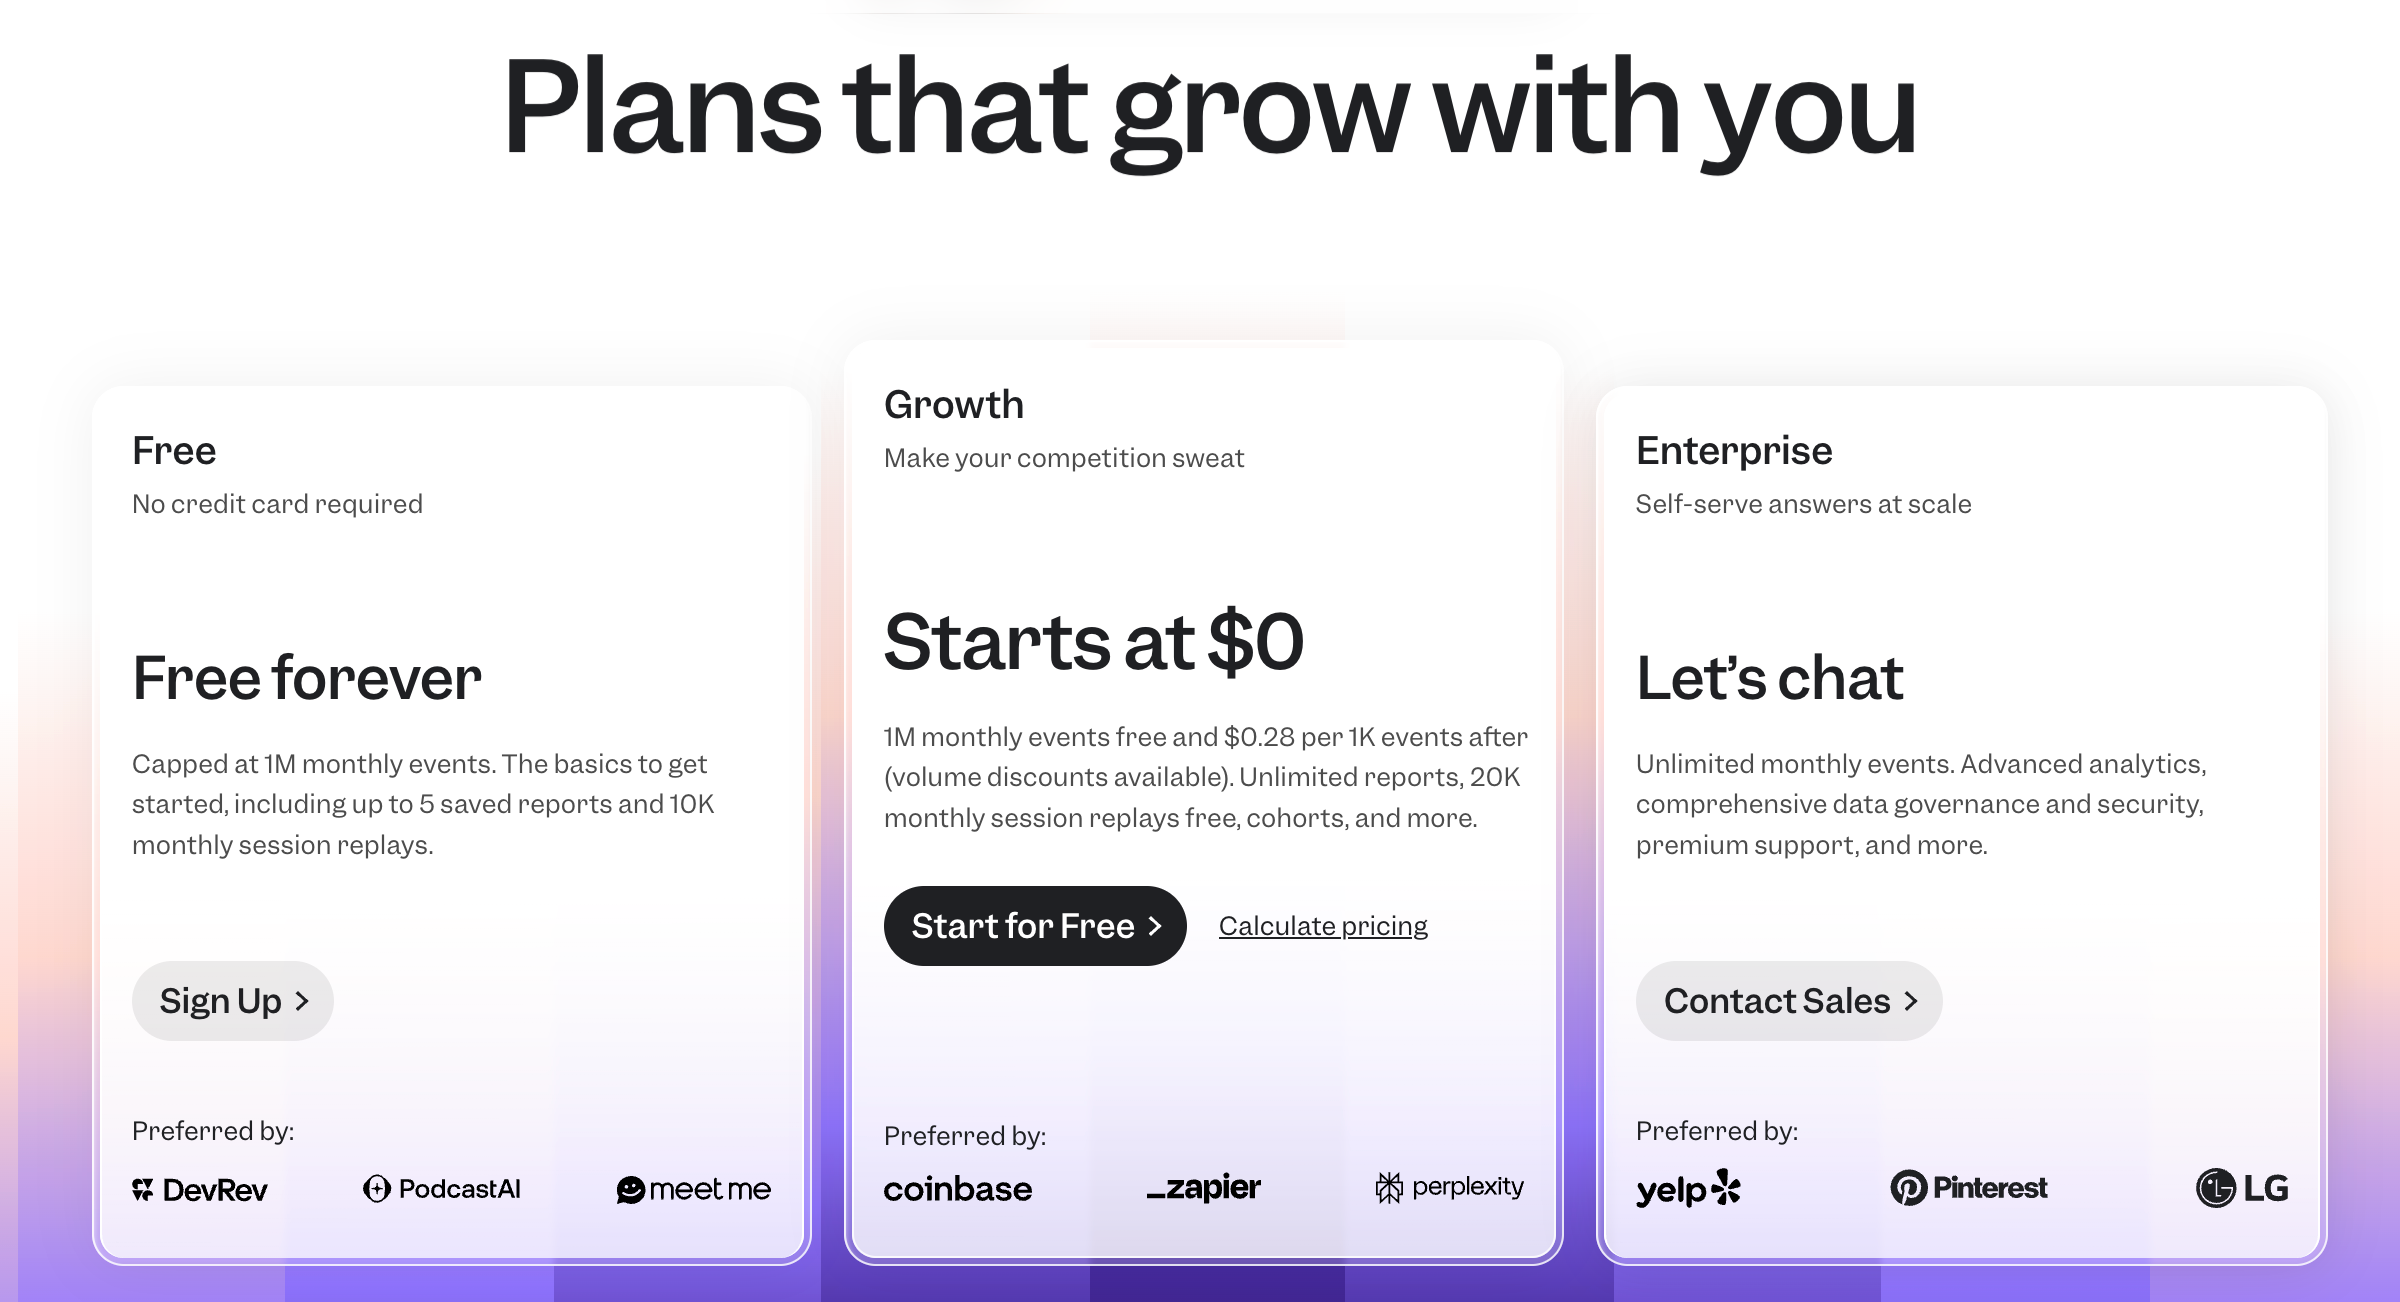
4. Mixpanel
Mixpanel is a robust analytics platform designed to help teams track, analyze, and optimize user interactions through event-based data. It’s built for data-driven organizations that want deep insight into how users move through their product, which features they engage with, and what drives conversions.


Key features
Event-based analytics: Capture every key user interaction, from clicks and swipes to feature engagement.
Funnels & Retention analysis: Track user journeys, measure drop-offs, and identify conversion bottlenecks.
Advanced segmentation: Filter users based on demographics, behavior, or engagement for targeted analysis.
Custom dashboards & reports: Build visual reports to track KPIs in real time.
Pricing
Mixpanel offers a free plan with limited data points and reports. Paid plans start with Growth (for scaling teams) and Enterprise (for large organizations needing advanced analytics and support). Pricing varies based on data volume and features.


Pros
Excellent for detailed event and funnel analysis.
Highly customizable dashboards and queries.
Real-time insights for faster decision-making.
Scales well for growing data needs.
Wide range of integrations with data and marketing platforms.
Cons
No session replay or heatmap visualization.
Complex setup for non-technical teams.
Requires manual event configuration.
Primarily focused on quantitative, not qualitative, insights.
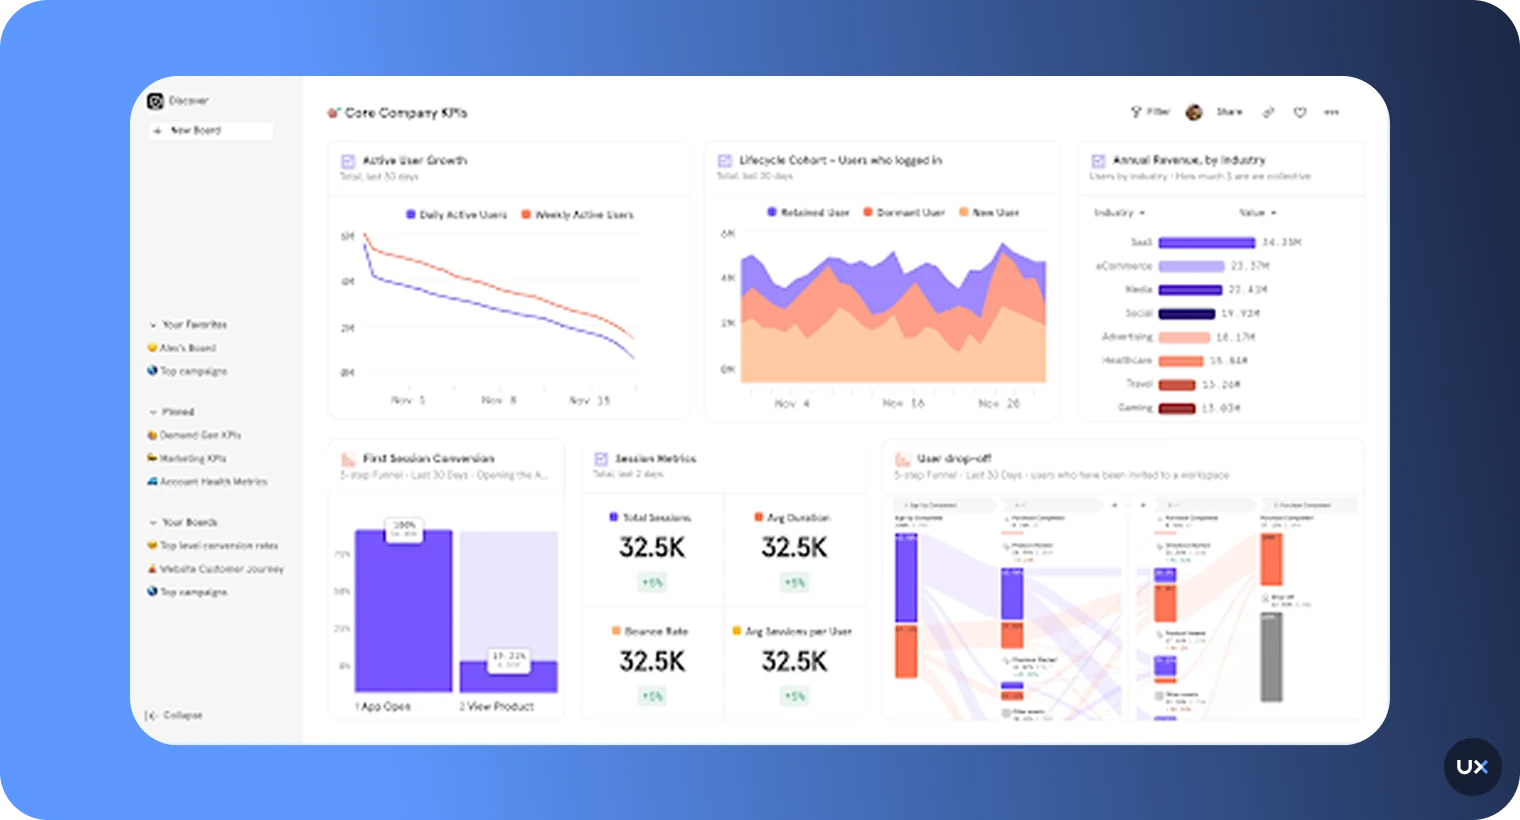
5. Amplitude
Amplitude is a product and user behavior analytics platform that helps digital teams understand how people use their product, identify friction in the user journey, and drive growth through data-driven decisions. It’s designed for product, growth, and data teams who want deep behavioral insights, cohort analysis, and experimentation tools to improve activation, retention, and lifetime value.


Key features
Behavioral analytics: Track user actions, funnels, and engagement patterns across web and mobile.
Retention & cohort analysis: Identify which behaviors lead to long-term retention and segment users by lifecycle stage.
User journey mapping: Visualize paths users take, revealing drop-offs and conversion bottlenecks.
A/B testing & experimentation: Test product changes and measure impact on user behavior and KPIs.
Predictive analytics: Machine-learning insights to forecast churn, identify power users, and measure value drivers.
Pricing
Amplitude offers a free plan with core analytics and limited seats. Paid Growth and Enterprise plans unlock advanced features like predictive analytics, experimentation, governance tools, and larger data volumes. Pricing varies by event volume, data retention, and seats.


Pros
Good behavioral product analytics and retention modeling.
Excellent visualization tools for funnels, cohorts, and journeys.
Scales well for startups to large enterprises.
Integrates effectively with BI and marketing tools for broader analytics workflows.
Scales well for companies that have dedicated analysts and data engineering support.
Cons
Can have a learning curve for non-analytical users.
Advanced capabilities require solid event taxonomy and data setup.
Pricing can increase significantly with high event volume.
Less focused on in-app engagement.
Mobile app analytics techniques
Mobile app analytics, also known as experience analytics, goes beyond traditional tracking. It combines quantitative data (what users do) and qualitative insights (why they do it) to give you a complete view of user behavior.
Let’s look at them in detail.
Qualitative methods
Qualitative analysis focuses on subjective information like user behavior, emotions, and experiences. It focuses on the ‘why’ behind user behavior.
Usability testing and user feedback are some of the better-known qualitative analysis methods. While these techniques can be helpful, they don’t tell the whole story of what users do on an app, but rather what they think they do.
Opinions are powerful, and this feedback is invaluable, but observing how real users truly behave is a different story. When paired with data visualization, qualitative analysis techniques can be easily interpreted.
These are the main methods used in qualitative analysis:
Gesture-based heatmaps. Heatmaps visualize how users engage with your app. Tracking gestures (like double taps, long presses, and frustration signals like rage taps, etc.) is invaluable to understanding customer needs and avoiding churn.
Download this complete guide for understanding mobile app heatmaps.


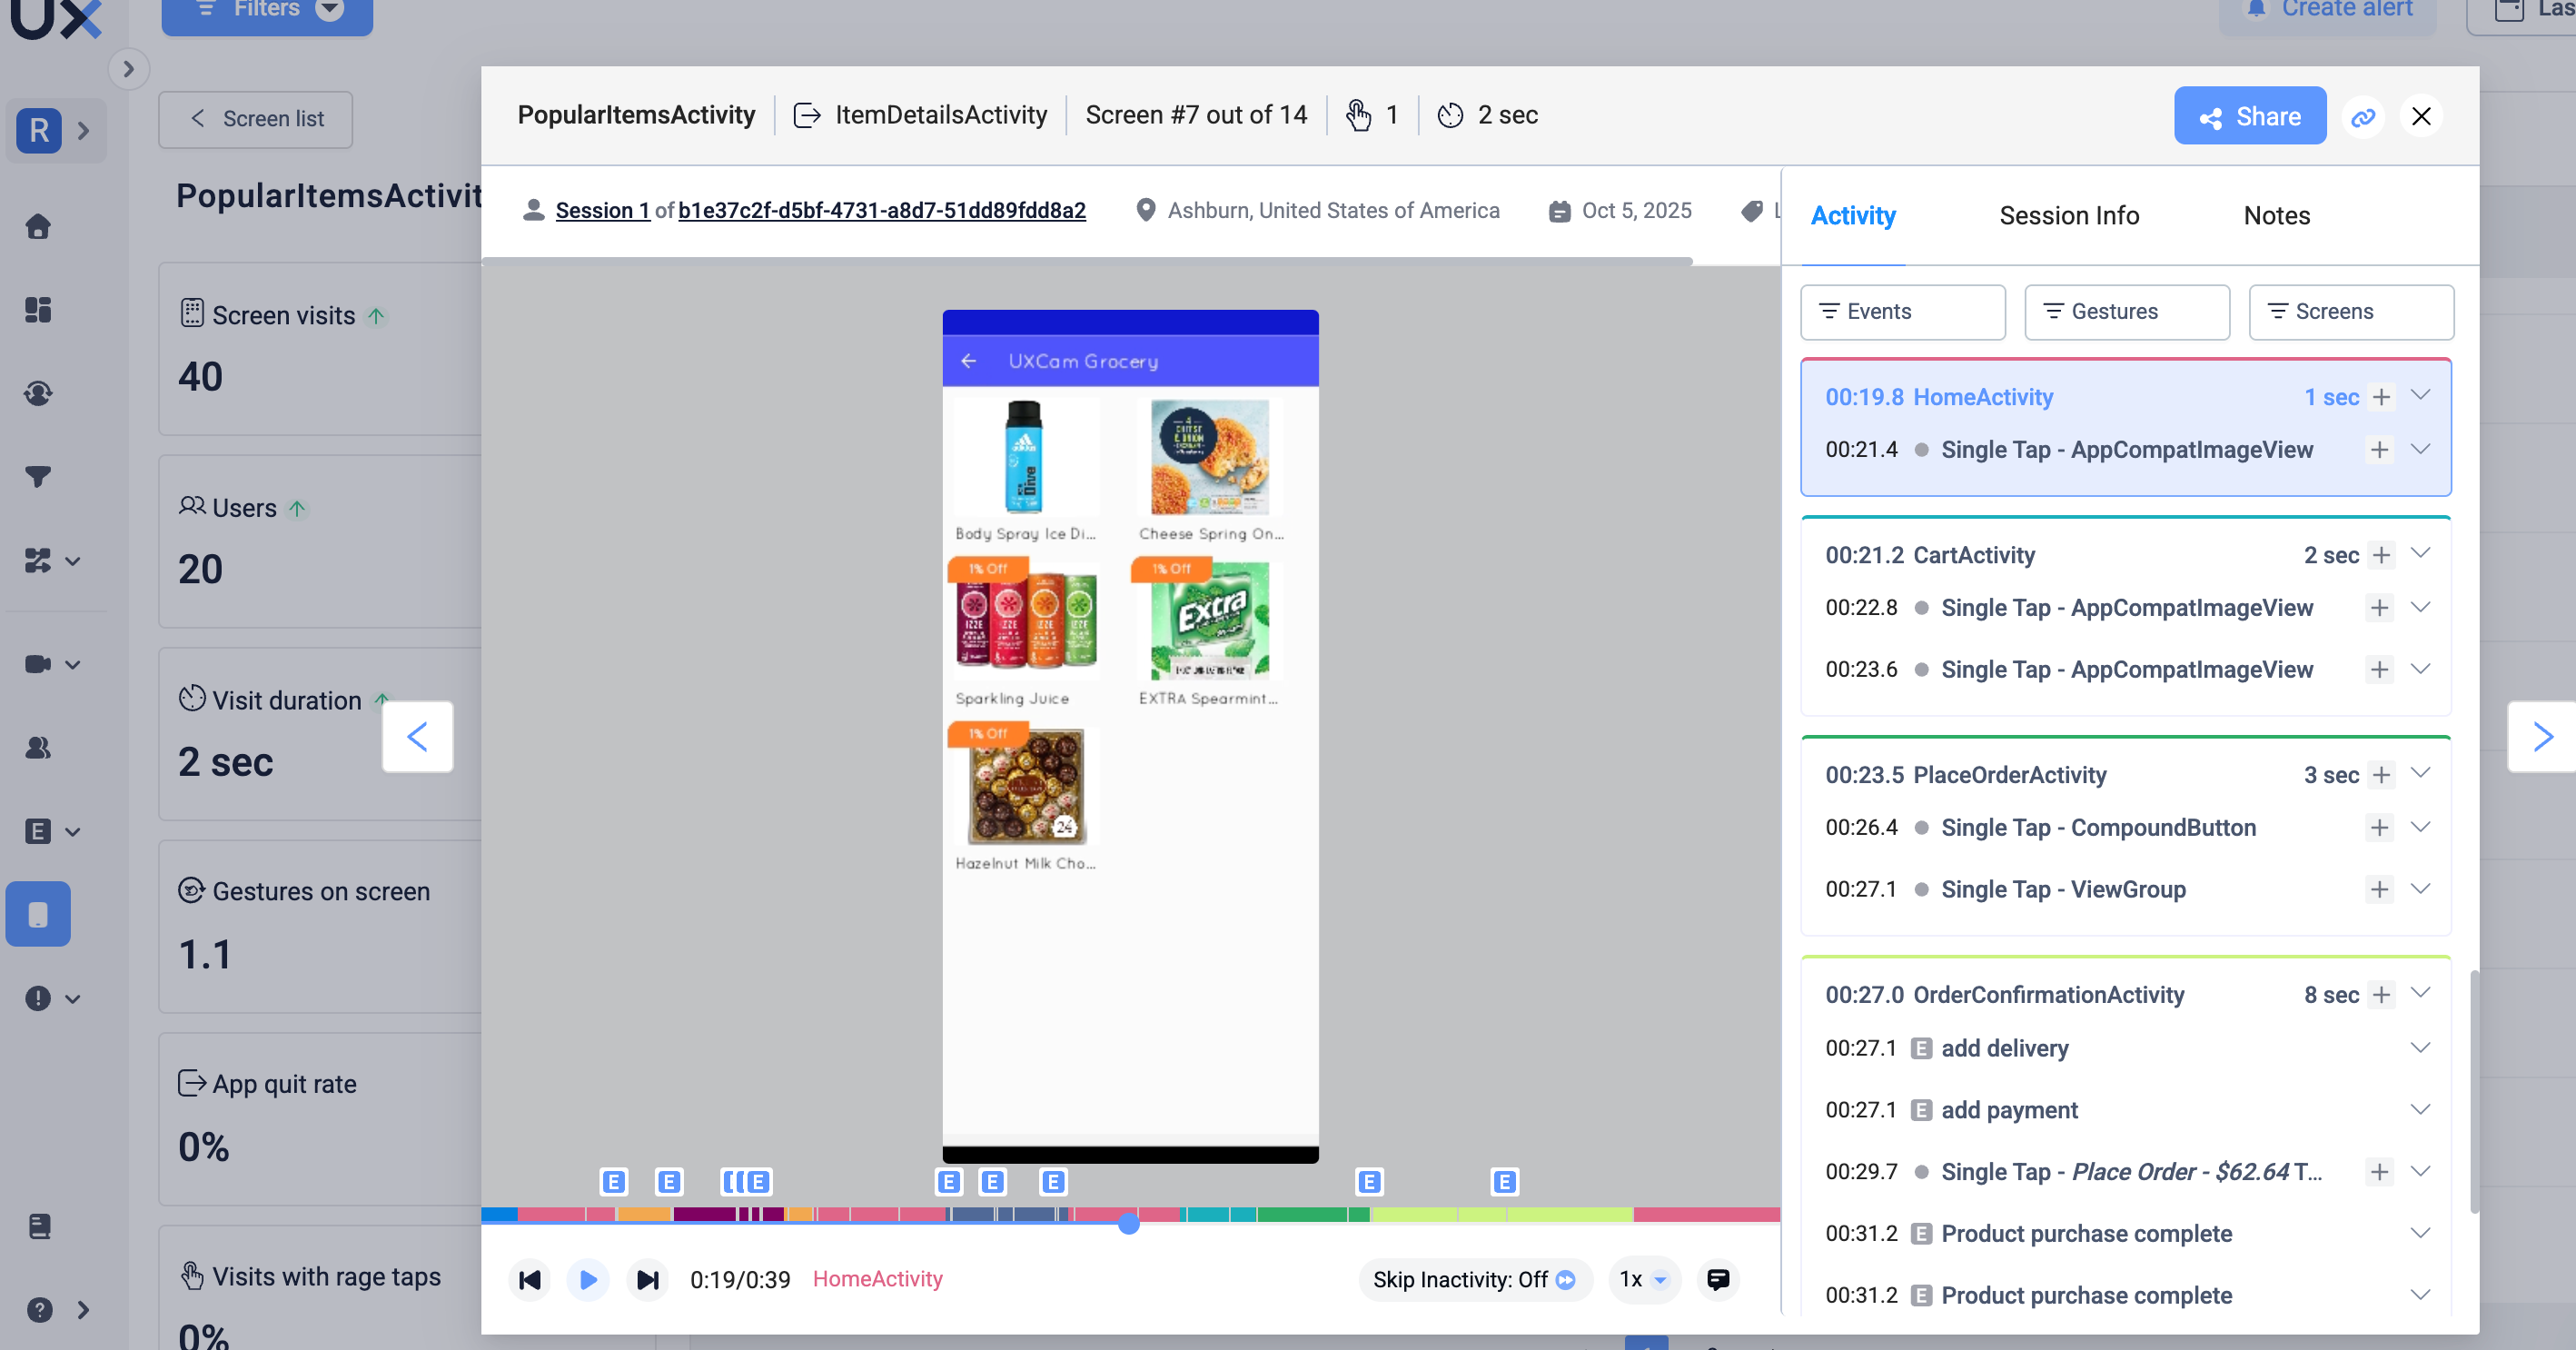
Session recordings. Also known as session replay, this method allows you to view the user's experience and journey from the moment they open the app to when they send it into the background or close it.


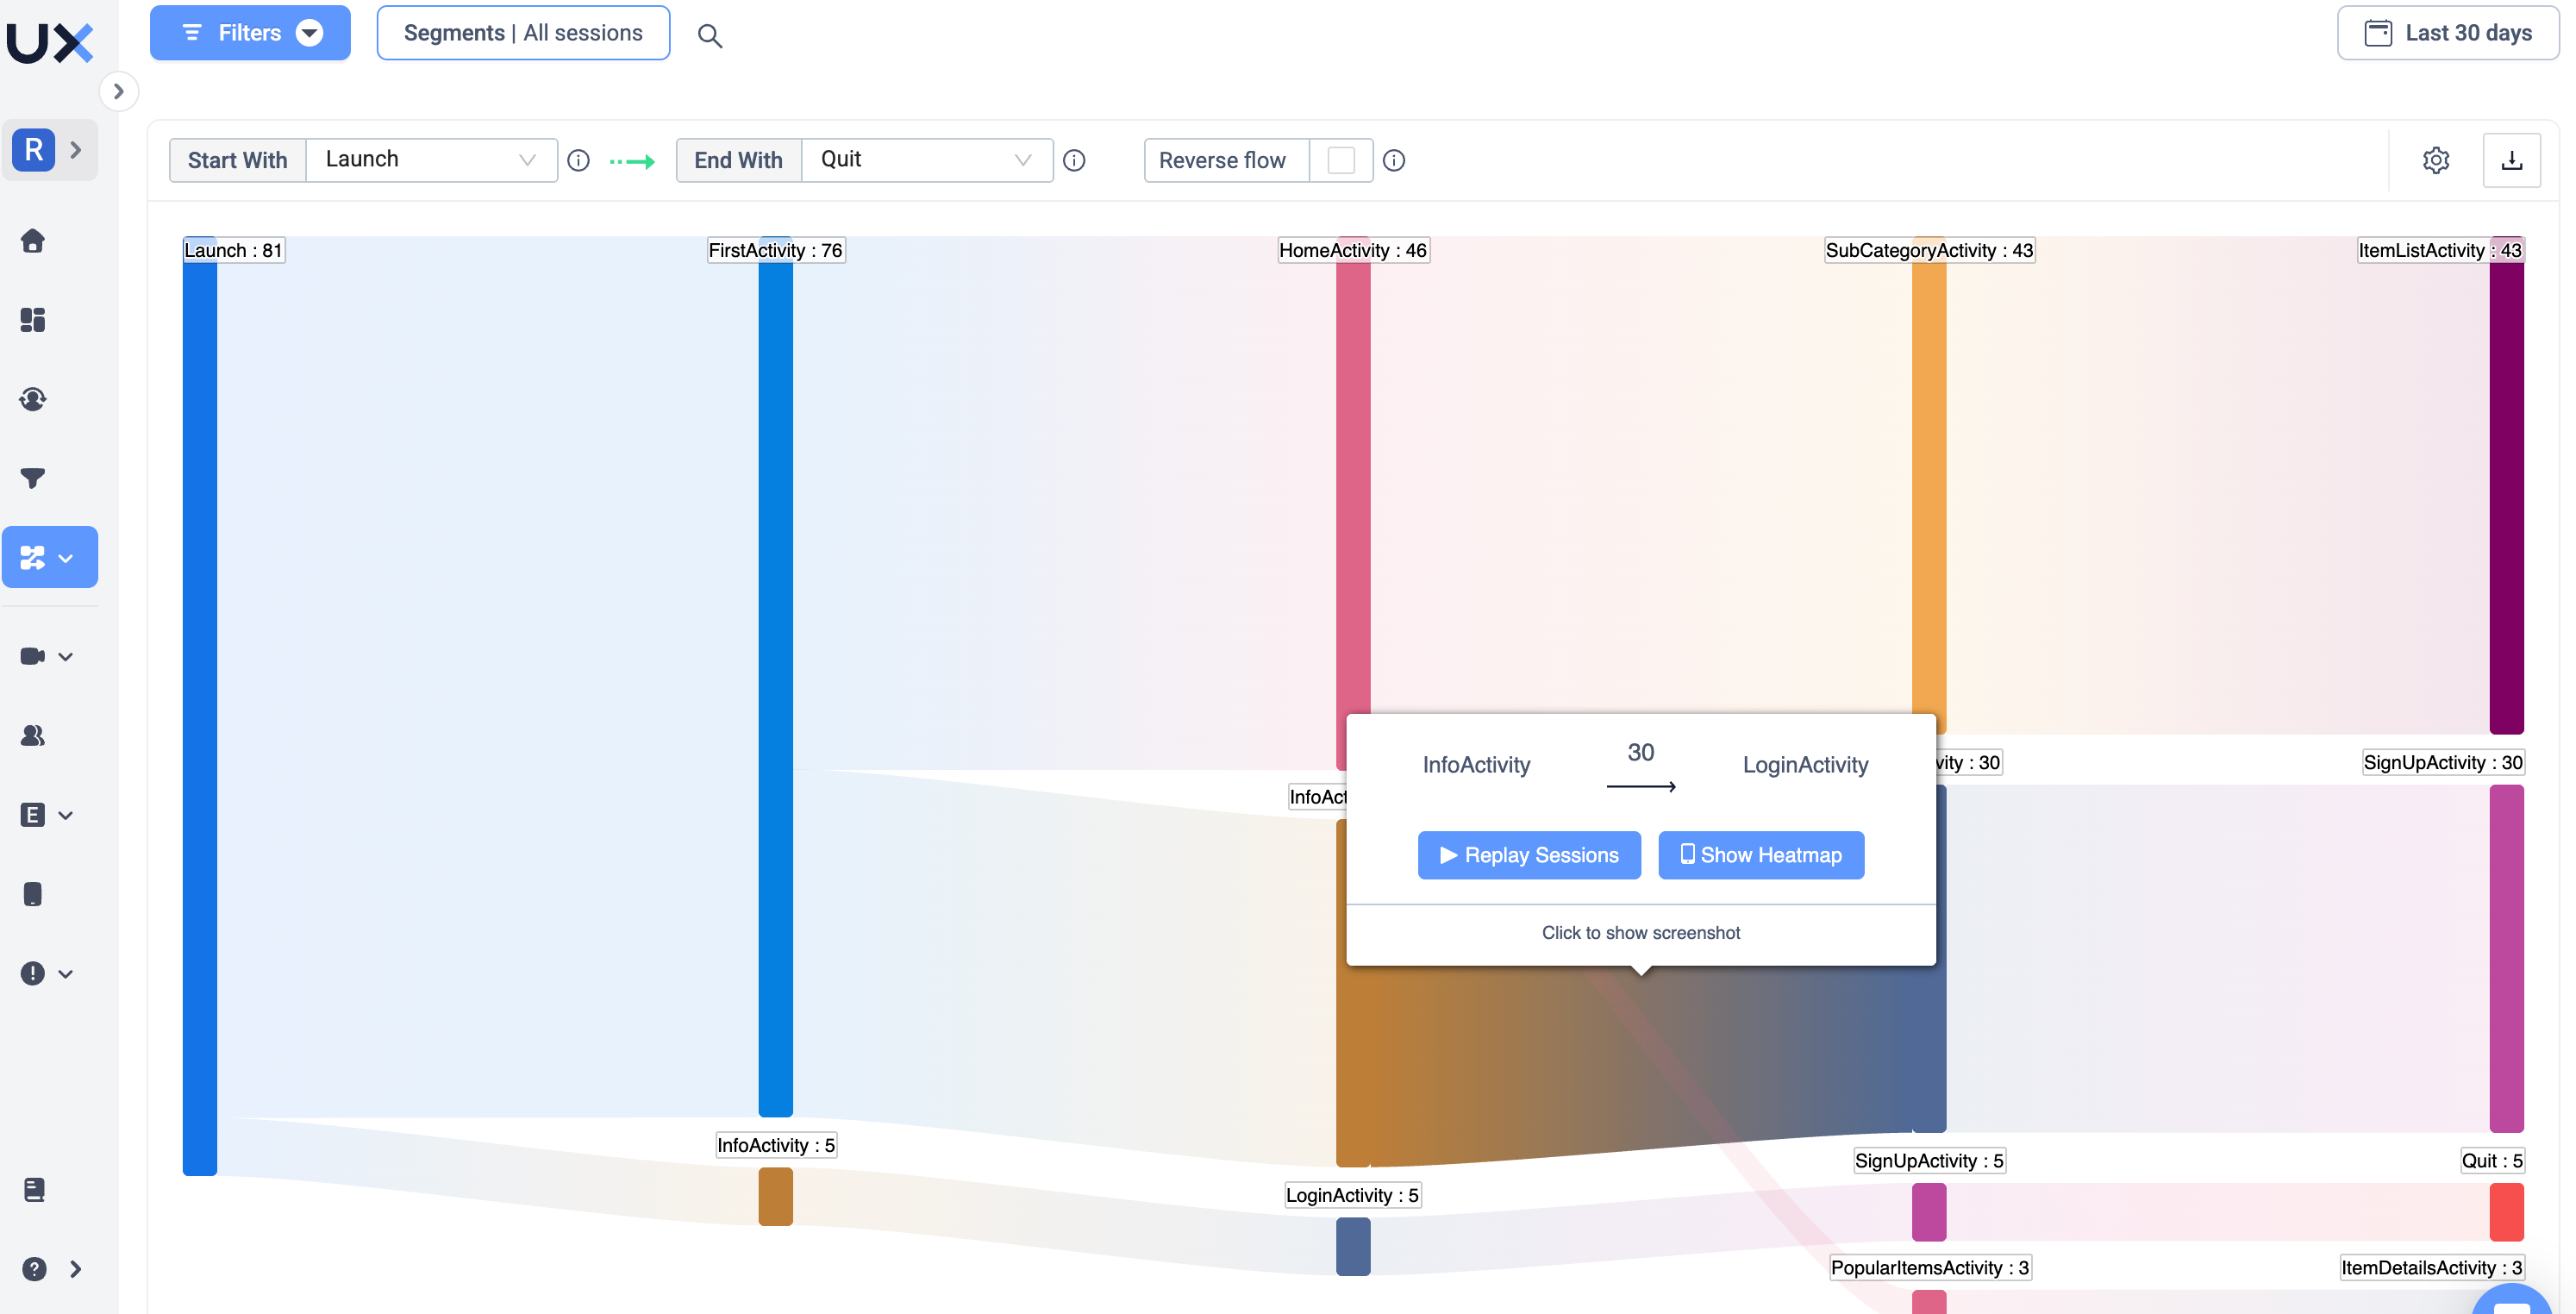
Behavioral screen flow. Screen flows validate funnels, prove your hypotheses, or show what unexpected paths users take in your app.


Quantitative methods
Quantitative analysis describes objective information that can be expressed with numbers, graphs, charts, etc. It focuses on the ‘what’.
There are three main quantitative analytics methods:
User analytics. This combines lots of technical information, like user device data, with demographic data (like age or gender).
Funnel analysis. Funnels break up user journeys into key milestones. Most funnels will only work in tandem with custom event analytics. UXCam allows users to view sessions based on the steps in the funnel.
Session exploration. This technique combines many quantitative data points to gain a complete picture of the sessions taking place on your mobile application. By analyzing these metrics over time, you can see trends and conclude specific user sets.
Technical analysis
Technical analytics comprise crash analytics, exceptions, and UI freeze analytics. Here’s a short overview:
Crash analytics. This method helps you stay on top of technical problems that can damage the customer experience. It can also help decipher drops in a defined funnel. With UXCam, engineers can see crash rates, the number of users affected, the reasons the crash occurred, and comparisons across different versions, devices, and platforms.
UI freeze analytics. Also known as issue analytics, digs into the issues that cause the crashes in the first place. With UXCam, UI freeze analytics measures the same things that crash analytics does, plus screens the freeze happened, and how long it lasted.
Privacy and mobile app analytics
For many product and mobile teams, it’s valuable and insightful to gain all of this data about user behavior and app performance. But, is it safe?
Many apps need to collect personal information about their users to allow them access to the app. Think about financial apps that need users to go through a KYC process and enter data points like date of birth, addresses, and copies of passports or ID cards. When looking into how your user behaves on your app, you’ll need to take a look at session recordings, even for the screens that collect the most sensitive information.
When sending sessions to a mobile app analytics platform, companies need to know that their users' data is safe. With UXCam, you’ll be able to mask texts, elements, or screens from being recorded, as well as being able to hide all text fields to block out the input and occlude specific screens.
If you’re using customizable dashboards, you can choose to blur all screens from a specific set straight from your dashboard. You can also set rules for which screens you’d like blurred or occluded, blur only specific elements of a screen, or blur entire screens.
Measuring and tracking mobile app analytics is valuable for many different teams. Having all your key app metrics in one place will make it easier to check the health of your app and business.
Best practices for implementing mobile analytics
1. Set clear goals
Define objectives: Clearly outline what you want to achieve with mobile analytics. Whether it's improving user engagement, increasing retention rates, or boosting revenue, having specific goals will guide your analytics strategy.
Prioritize metrics: Identify the key performance indicators (KPIs) that align with your objectives. Focus on metrics that provide actionable insights and help you measure progress towards your goals.
2. Select the right tools
Research options: Evaluate different mobile analytics tools to find the one that best fits your needs. Consider factors like ease of use, features, integration capabilities, and cost.
Choose comprehensive solutions: Opt for tools that offer a wide range of analytics capabilities, including user behavior tracking, performance monitoring, and session recordings.
Test and compare: Trial multiple tools to see which one provides the most accurate and relevant data for your app. Compare their performance and usability before making a final decision.
3. Ensure data privacy and security
Implement privacy policies: Develop and enforce clear privacy policies that outline how you collect, store, and use user data. Make sure users are informed and give consent.
Comply with regulations: Stay up to date with data privacy regulations like GDPR, CCPA, HIPAA, and others that apply to your users. Ensure your analytics practices comply with these laws.
Secure data storage: Use encryption and other security measures to protect user data. Regularly review and update your security protocols to safeguard against breaches.
4. Integrate analytics with your app
Add SDKs: Incorporate the analytics software development kits (SDKs) into your app’s code base. Follow the provider’s instructions to ensure proper setup.
Enable key features: Activate important features like event tracking, session recordings, and crash reporting to get comprehensive data on user interactions and app performance.
Regularly update SDKs: Keep your analytics tools up to date by regularly updating the SDKs. This ensures you have access to the latest features and security enhancements.
5. Analyze and act on data
Monitor metrics: Regularly check your dashboards and reports to monitor the key metrics. Look for patterns, trends, and anomalies that can inform your decisions.
Generate insights: Use the collected data to gain insights into user behavior and app performance. Identify areas for improvement and potential growth opportunities.
Implement changes: Based on your analysis, make data-driven changes to your app. Test new features, redesign user flows, and fix bugs to enhance the user experience.
6. Foster a data-driven culture
Educate your team: Ensure everyone on your team understands the importance of mobile analytics. Provide training on how to use the tools and interpret the data.
Share insights: Regularly share analytics findings with your team. Use this data to inform product development, marketing strategies, and user support efforts.
Encourage experimentation: Promote a culture of experimentation where data is used to test hypotheses and validate decisions. Use A/B testing and other methods to continuously improve your app.
Common challenges in mobile analytics and solutions
Implementing mobile analytics can present several challenges. Here’s how you can address them effectively:
1. Data fragmentation
Challenge: Data from different sources can be fragmented, making it hard to get a comprehensive view.
Solution: Use a unified analytics platform that integrates data from various sources, such as user behavior, performance metrics, and demographic information. This will provide you with a holistic view of your app’s performance and user interactions.
2. User privacy concerns
Challenge: Users are increasingly concerned about how their data is collected and used.
Solution: Implement robust privacy policies and ensure transparency with your users. Inform them about what data you collect, why you collect it, and how it will be used. Obtain explicit consent from users and provide options to opt out of data collection.
3. Technical integration challenges
Challenge: Integrating analytics tools with your app can be technically complex.
Solution: Choose analytics tools with well-documented SDKs and integration guides. Work closely with your development team to ensure seamless integration. Regularly update your analytics tools to keep up with new features and improvements.
4. Data accuracy and reliability
Challenge: Inaccurate or unreliable data can lead to poor decision-making.
Solution: Regularly audit your data collection processes to ensure accuracy. Validate your data by cross-referencing it with other data sources. Use analytics tools that offer error detection and correction features.
5. Analyzing and interpreting data
Challenge: Making sense of large volumes of data can be overwhelming.
Solution: Focus on key metrics that align with your business goals. Use data visualization tools to make complex data easier to understand. Provide training for your team on how to analyze and interpret data effectively.
6. Balancing quantitative and qualitative data
Challenge: Relying solely on numbers can miss the nuances of user behavior.
Solution: Combine quantitative data with qualitative insights. Use methods like session recordings, user surveys, feedback, and usability testing to complement your analytics data. This balanced approach will give you a deeper understanding of user behavior and preferences.
7. Keeping up with rapid changes
Challenge: The mobile app market is constantly evolving, making it hard to stay current.
Solution: Stay informed about the latest trends and updates in mobile analytics. Regularly review and adjust your analytics strategies to keep pace with changes. Invest in continuous learning and development for your team.
Future trends in mobile analytics
Staying ahead in mobile analytics means keeping up with emerging trends. Here’s what you need to focus on:
1. AI-powered analytics
Embrace machine learning: Leverage AI and machine learning to gain deeper insights. These technologies can identify patterns and predict user behavior more accurately than traditional methods.
Automate insights: Use AI to automate data analysis and generate actionable insights. This saves time and allows you to focus on implementing improvements.
2. Real-time data processing
Monitor in real-time: Implement real-time analytics to track user behavior as it happens. This enables you to respond quickly to issues and opportunities.
Enhance user experience: Use real-time data to personalize the user experience dynamically. Adjust content, recommendations, and features based on current user interactions.
3. Privacy-first analytics
Prioritize user privacy: Adopt privacy-first approaches to build trust with your users. Implement features like data anonymization and user consent management.
Comply with regulations: Stay compliant with data privacy regulations such as GDPR and CCPA. Regularly review your privacy policies and update them as needed.
4. Enhanced data visualization
Utilize advanced dashboards: Choose an analytics solution like UXCam that provides intuitive dashboards for data visualization. These make it easier to interpret complex data.
Share insights easily: Use visualizations to communicate insights across your team effectively. This promotes data-driven decision-making throughout your organization.
5. Increased focus on user journey analytics
Map detailed journeys: Track detailed user journeys to understand how users navigate through your app. This helps you identify pain points and opportunities for improvement.
Improve conversion funnels: Analyze user flows to optimize conversion funnels and reduce drop-offs at critical stages.
Next steps for your mobile analytics strategy
Stay updated: Regularly review industry news, research reports, and case studies to keep up with trends.
Invest in training: Ensure your team is well-versed in the latest tools and techniques in mobile analytics.
Experiment and innovate: Continuously test new approaches and features to stay competitive.
Prioritize user feedback: Use both quantitative and qualitative data to understand user needs and preferences.
Review and adjust: Regularly assess your analytics strategy and make adjustments based on data insights and market changes.
Mobile Analytics FAQs
What is mobile usage analytics?
Mobile usage analytics involves the collection, measurement, and analysis of data generated by users interacting with mobile applications and mobile websites. This type of analytics helps businesses and developers understand how users engage with their mobile platforms, providing insights that can improve user experience, enhance app performance, and drive strategic decisions.
How can I start with mobile app analytics?
Just start free trial and sign up for an account. Once you're logged in, you can add a new app to your UXCam account. You will need to add the UXCam SDK to your app's code base.
What's the best mobile app analytics tool?
UXCam is renowned for its deep analysis of the user journey. It provides high-fidelity insights, empowering mobile teams with fast, contextual data. By recording user sessions and creating heatmaps, UXCam enables you to see how users navigate through your app and identify the most and least used elements. Its key features include User Analytics, Heatmap and Screen Analytics, Funnel and Event Analytics, Issue Analytics, and 3rd Party Integrations.
Why do companies use mobile app analytics?
Companies use mobile app analytics for several reasons, all of which are aimed at improving the performance and profitability of their mobile applications. Here are some key reasons:
- Understand user behavior
- Improve user experience
- Increase user retention
- Monitor app performance
Is UXCam only for mobile apps?
No. UXCam is now a cross-platform analytics solution; it works for mobile, web, and hybrid products. You can track user journeys, generate heatmaps, replay sessions, and get instant AI insights (via Tara AI) across all devices in one unified platform.
How does UXCam protect user privacy?
UXCam is built with privacy-first architecture and is fully compliant with GDPR, CCPA, and HIPAA. It automatically masks sensitive user data, blurs private fields, and ensures all recordings and insights are securely processed and stored.
How is UXCam different from tools like Mixpanel or Firebase?
While Firebase and Mixpanel specialize in event-based quantitative analytics, UXCam provides both quantitative and qualitative insights. It shows not just what users do, but why—through session replays, heatmaps, and AI-powered interpretation. This makes it ideal for teams focused on UX, retention, and cross-platform experience optimization.
You check our Mixpanel vs UXCam page to learn more.
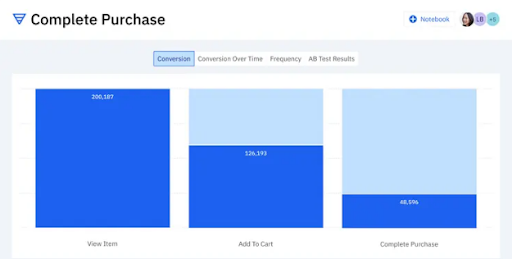
Can mobile analytics tools help improve conversion rates?
Absolutely. By revealing where users drop off or encounter friction, analytics tools guide teams in optimizing onboarding flows, CTAs, and checkout experiences. For example, with UXCam, you can visualize drop-off points in funnels and identify precisely which UI changes can improve conversions.
Does UXCam offer a free trial?
Yes. You can explore UXCam through a free trial to see how session replays, heatmaps, and retention analytics can help you understand and improve your product experience before upgrading to a custom enterprise plan.
Related articles
Most important Mobile App Analytics Metrics to measure Essential Mobile App Metrics to track in your job role Mobile App KPI Dashboard Examples and How to Use Them
AUTHOR
Jonas Kurzweg
Product Analytics Expert
What’s UXCam?
Related articles


Conversion Analysis
Flutter Mobile App Analytics: A Practical Implementation Guide
Mobile app analytics for Flutter. Easy integration, detailed insights, and robust...
Jonas Kurzweg
Product Analytics Expert


Conversion Analysis
Flutter Session Replay & Recording for Apps: UXCam
Optimize your Flutter app's performance with UXCam's session recording and replay tool. Easy integration, optimized features, and strong...
Jonas Kurzweg
Product Analytics Expert
Conversion Analysis
What is Mobile Analytics? Guide, Tools & Best Practices
Mobile analytics take the guesswork out of understanding how users interact with your app. Learn what mobile analytics is, why it's important, and how it differs from web...
Jonas Kurzweg
Product Analytics Expert