Back to blog
10 MIN READ
What is Web Analytics? Definition, Metrics & Best Practices
PUBLISHED
13 November, 2024
UPDATED
2 December, 2025


Product Analytics Expert


Web analytics is the process of collecting, analyzing, and interpreting data from a website or app to understand user behavior and improve digital performance. It provides insights into user behavior, helping Product Management, UX, Data Analysis, and Marketing teams make data-driven decisions to enhance user experience and drive growth.
This article explores what web analytics entails, its importance across different departments, and the key tools that can help teams analyze user interactions to drive growth.
By the end, you’ll know how to leverage web analytics to meet your goals and optimize performance.
What is web analytics?
Web analytics is the process of tracking, collecting, and analyzing data from websites and web apps to understand how users interact with your digital experience.
According to HubSpot’s State of Marketing Report, companies that use web analytics effectively are 2.8× more likely to achieve their marketing goals, proving how critical data-driven decision-making is for growth.
Web analytics helps teams identify which pages attract visitors, how long they stay, and what actions they take. With these insights, businesses can optimize content, improve conversions, and uncover usability issues that affect performance.
Examples of web analytics
Web analytics includes a range of tools and techniques used to measure user behavior and website performance across multiple contexts. They include;
On-site analytics: This type focuses on metrics related to user interactions on a website. It includes tracking unique visitor counts, traffic sources, bounce rates, and user behavior on landing pages. Tools like Google Analytics provide insights into how users navigate a site, helping businesses optimize their marketing strategies based on real user data
Off-site analytics: These analytics measure how external factors influence website traffic, such as social media engagement or referral traffic from other sites. They help in understanding the broader impact of marketing campaigns beyond the website itself.
Product analytics: These tools focus on user engagement with specific products or services offered online. They track metrics such as feature usage, conversion rates, and customer journey mapping to optimize product offerings.
Why is web analytics important for businesses?
Web analytics plays a crucial role in helping teams make data-driven decisions that enhance user experiences and drive growth.
Each team, whether Product Management, UX, Marketing, or Data Analysis, leverages web analytics differently to gain insights and guide their strategies.
Here’s a quick look at how web analytics supports these key roles:
| Role | How they use web analytics |
|---|---|
| Product Managers | To identify which features users value most, helping prioritize feature updates and new developments. This data supports data-driven decisions in product planning. |
| UX Designers | To uncover pain points and areas where users encounter friction, guiding design improvements that enhance user experience and usability. |
| Marketers | To measure campaign performance, track audience engagement, and refine targeting, optimizing the reach and effectiveness of marketing efforts. |
| Data Analysts | To interpret user behavior data, generate insights, and create reports that inform strategies across product, UX, and marketing teams, enabling smarter business decisions. |
What web analytics can tell you?
Web analytics provides a clear picture of user behavior on your site or app, helping you make informed improvements. Here’s a quick look at the insights it offers:
User acquisition: Understand which channels (e.g., search, social) bring in traffic, helping you optimize marketing efforts.
Content engagement: See which pages or features get the most attention, allowing you to focus on popular areas.
Drop-off points: Identify where users leave, highlighting areas for usability or content improvements.
Conversion success: Measure the effectiveness of calls to action, guiding adjustments to boost conversions.
Device preferences: Learn which devices users prefer, informing mobile and cross-platform optimization.
User journeys: Track paths from landing to conversion to streamline navigation and improve flow.
High-value users: Segment loyal or engaged users, enabling targeted retention strategies.
Key metrics in web analytics
Some core web analytics metrics offer insights into how users interact with your site or app. Tracking these foundational metrics helps you measure engagement, understand content effectiveness, and optimize user experience.
Here’s a breakdown of the most essential metrics to monitor:
| Metric | Description | Why it matters |
|---|---|---|
| Unique Visitors | Count of individual users within a set time period. | Indicates audience size and growth trends, highlighting your reach. |
| Pageviews / Screen Views | Total views of pages (web) or screens (app) by users. | Identifies popular content, guiding content strategy and structure. |
| Session Duration | Average time users spend per visit. | Reflects user engagement, with longer durations suggesting high interest. |
| Bounce Rate | Percentage of users leaving after viewing one page/screen. | High bounce rates signal potential content or UX issues. |
| Conversion Rate | Percentage of users completing a desired action (e.g., purchase). | Measures success in achieving goals like sales or sign-ups. |
| Retention Rate | Percentage of users returning over a period. | Indicates user satisfaction and loyalty, key for growth. |
| Churn Rate | Percentage of users who stop using your product. | Reducing churn stabilizes your user base and revenue. |
| Engagement Metrics | Measures of interactions, such as pages per session or events. | Shows user interest in content and features, revealing high-activity areas. |
| Acquisition Channels | Sources through which users access your site/app (e.g., organic, social). | Identifies effective channels, informing marketing strategies. |
| Goal Completions / Events | Count of completed goals or triggered events (e.g., clicks, form submissions). | Tracks progress toward key objectives, assessing feature or campaign performance. |
| Rage Clicks | Instances where users repeatedly click the same element in frustration. | Highlights usability issues and frustration points, revealing areas that may require design or functionality improvements. |
Top web analytics tools
Selecting the right web analytics tool can be overwhelming with so many options. Each tool offers unique features that cater to different needs, from user behavior tracking to conversion optimization.
Let's take you through some of the top tools and what they offer.
You can check out a detailed review of each tool in our review of the best web analytics tools
| Tool | Analytics type | Best for | Key features | Pricing |
|---|---|---|---|---|
| UXCam | Product analytics (web + mobile) | UX optimization, mobile/web apps | Session replay, heatmaps, funnel analysis, AI insights | Free, Custom Plans |
| Google Analytics 4 | On-site analytics (web + app) | Marketing and event tracking | Cross-platform data, predictive insights, customizable reports | Free, GA4 360 ($50k/year) |
| Adobe Analytics | On-site & cross-channel analytics | Enterprises needing advanced analytics | Cross-channel tracking, predictive analytics, attribution modeling | Custom pricing |
| Hotjar | Product analytics (web only) | UX and conversion rate optimization | Heatmaps, session recordings, user feedback | Free, Plus ($49/month) |
| Mixpanel | Product analytics (web + mobile) | SaaS and mobile apps | Event tracking, funnel analysis, real-time reports | Free, Growth ($0.28/1k events) |
| Amplitude | On-site, Product analytics (web + mobile) | Product teams for user engagement | Cohorts, A/B testing, retention, and funnel analysis | Free, Growth ($61/month) |
| Matomo | On-site web analytics | Privacy-focused teams, open-source | Real-time analytics, session recordings, GDPR-compliant | Free, Cloud (€29/month) |
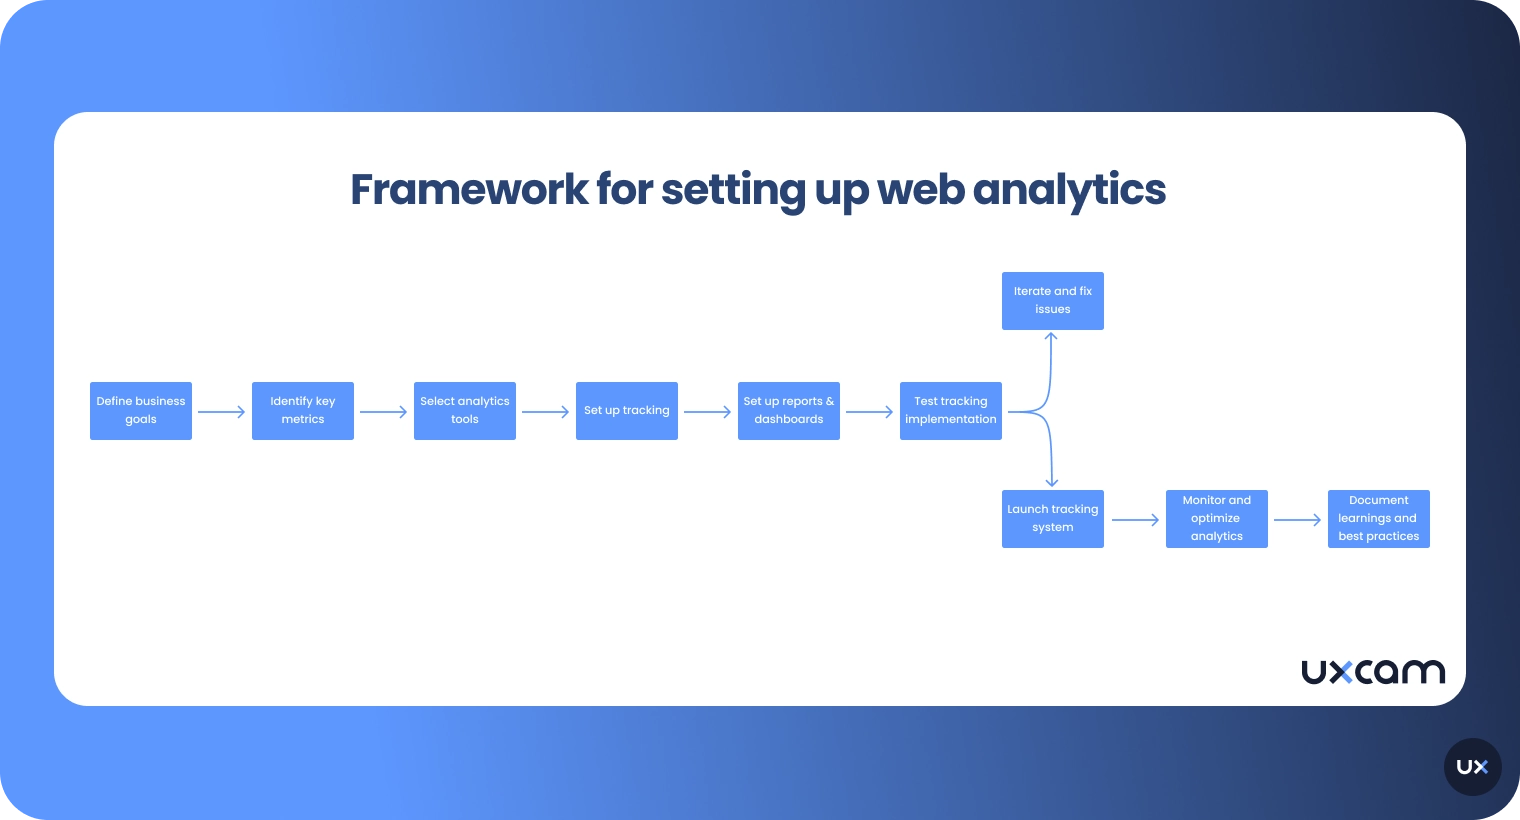
How to set up web analytics for your website or app
Here’s a simple guide to setting up web analytics for your website or application.
1. Choose the right analytics tool
Start by selecting a web analytics platform that aligns with your business goals, whether that’s product analytics, marketing insights, or UX optimization. Once you’ve chosen a tool, create an account and configure key settings such as your time zone, reporting currency, and data-sharing preferences.
Next, install your tracking code, set up goals, and customize reports to ensure you’re capturing and analyzing the data that matters most.
2. Install the tracking code
Your tracking code is what enables data collection on your website or app. Copy the unique code snippet provided by your analytics tool and embed it in your website’s <head> section or directly within your app’s codebase.
If you use a content management system (like WordPress or Shopify), you can often install this through built-in integrations or plugins. After installation, verify that tracking is active by checking your analytics dashboard for real-time data.
3. Set up goals and conversions
Goals and conversions help you measure key user actions, such as sign-ups, purchases, or downloads, that indicate success. Define what actions are most valuable to your business and configure them in your analytics tool.
You can track goals based on specific page views (e.g., a “thank you” page), button clicks, or time spent on site. This setup gives you a clear view of how well your website or app supports your business objectives.
4. Create custom reports and dashboards
Custom reports allow you to focus on the metrics that matter most to your team.Select dimensions (like device type or location) and metrics (like sessions or conversion rate) to analyze performance from multiple angles.
Use filters to narrow your view to specific audiences or behaviors, and build dashboards to monitor key metrics in one place. Custom reporting turns complex data into actionable insights, helping you make informed, data-driven decisions quickly.
Following these steps gives you a strong foundation in web analytics, allowing you to gather, interpret, and leverage data effectively. You can check out our detailed guide on website analysis for more insight.
Why you should choose UXCam for web analytics
UXCam empowers you to move faster, make better decisions, and build better products by combining powerful quantitative insights with qualitative context.


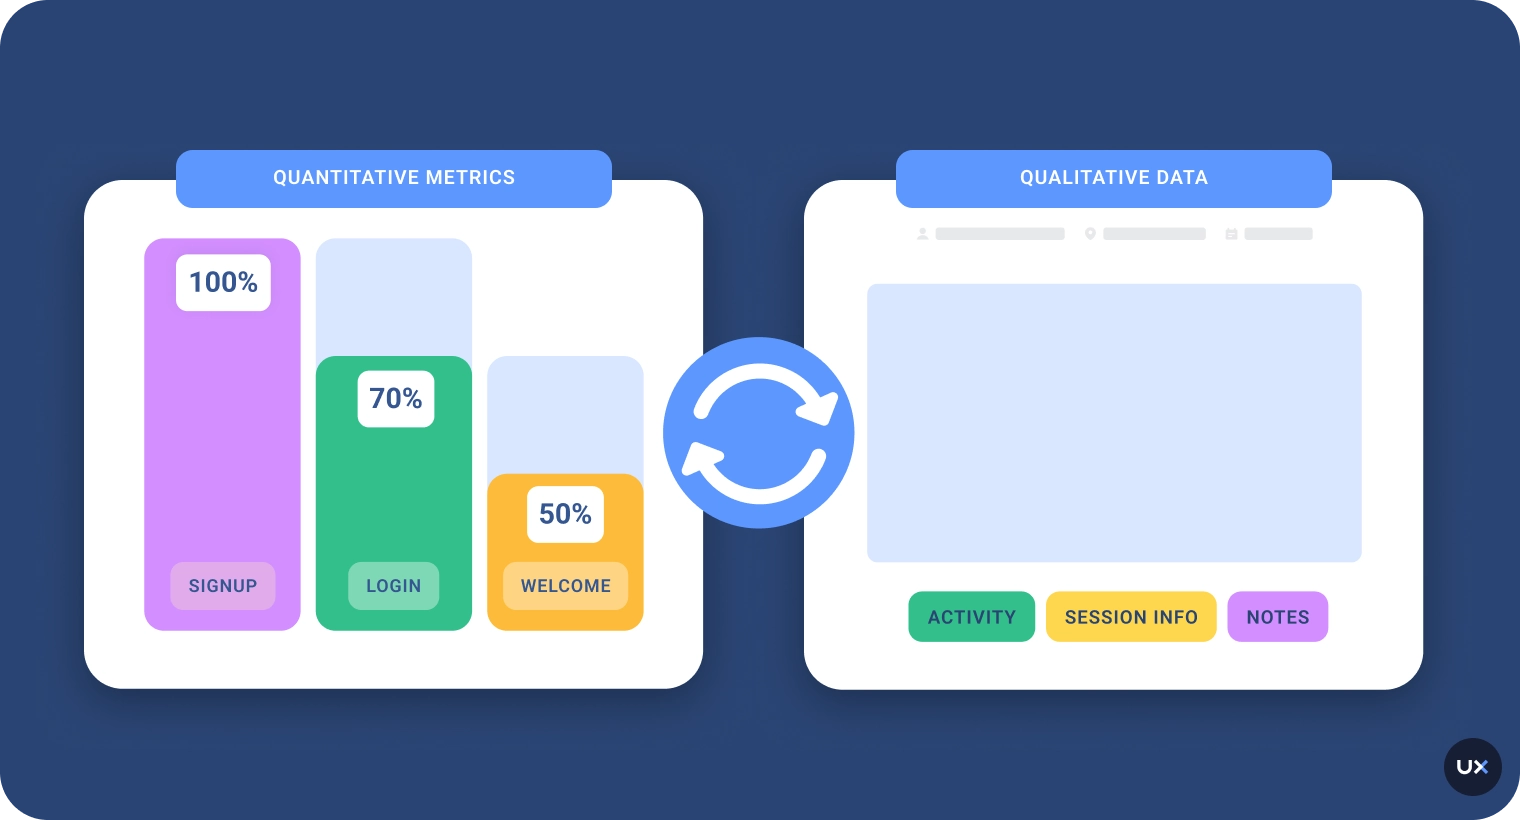
Most analytics tools force you to jump between dashboards, spreadsheets, and session replay apps to piece together a full picture. UXCam removes that friction with a native connection between product analytics and session replay, all from a single SDK. This means:
Spot a drop in your funnel? Jump straight into session replays of affected users.
See unusual behavior in a report? Click into sessions without losing context.
Want to analyze rage clicks or abandoned flows? Filter and view instantly.
Quick to set up, easy to use
Because of our autocapture technology, you don’t need to set up every single thing you want to track, insights just start showing up right away. You’ll also get access to ready-made filters and report templates, so there’s no need to build complex dashboards from scratch. And if you're working with a team, it’s easy to share dashboards with others so everyone, product, design, and engineering, is on the same page.
Flexible, but not overwhelming
Even though UXCam is simple to use, it still gives you the flexibility to go deeper when you need to. It covers most of the common product analytics use cases right out of the box, but you can also set up custom events and filters to answer more specific questions.


Get insights in a few click
One of the most powerful advantages is how quickly UXCam gets you to insight. With just a few clicks, you can segment sessions based on user behavior, generate dashboards from a specific cohort, or jump directly into sessions tied to key events. You’ll even uncover patterns and friction points you might not have thought to track, surfacing insights that traditional, manual analytics setups often miss.


Ready to level up your website’s user experience? Sign up for free to start using UXCam to capture rich behavioral insights, fix friction points, and increase your conversion rates.
Best practices for using web analytics effectively
Web analytics can be a game-changer, helping you understand your audience, improve engagement, and drive conversions. But to get real value, you need a strategy.


Set clear goals
Before diving into data, establish clear, measurable goals. What do you want to achieve? More leads, higher engagement, or increased sales? Your goals shape which metrics matter and prevent data overwhelm, keeping your focus on actionable insights.
Focus on key metrics
Web analytics platforms can track hundreds of metrics, but not all are relevant. Start with essential metrics, like Traffic sources, Bounce rate, Conversion rate. These core metrics provide a starting point. Refine them as you get clearer on what your goals are.
Use segmentation for deeper insights
Segment your data to uncover patterns. Break down users by demographics, traffic source, device, or behavior. For example, see if mobile users engage differently than desktop users. Segmentation reveals hidden trends and helps you tailor strategies to specific groups.
Track user journeys
Understand how users move through your site by tracking user journeys. Analyze where they start, the pages they visit, and where they drop off. This insight reveals friction points and areas to enhance, leading to a smoother user experience and higher engagement.
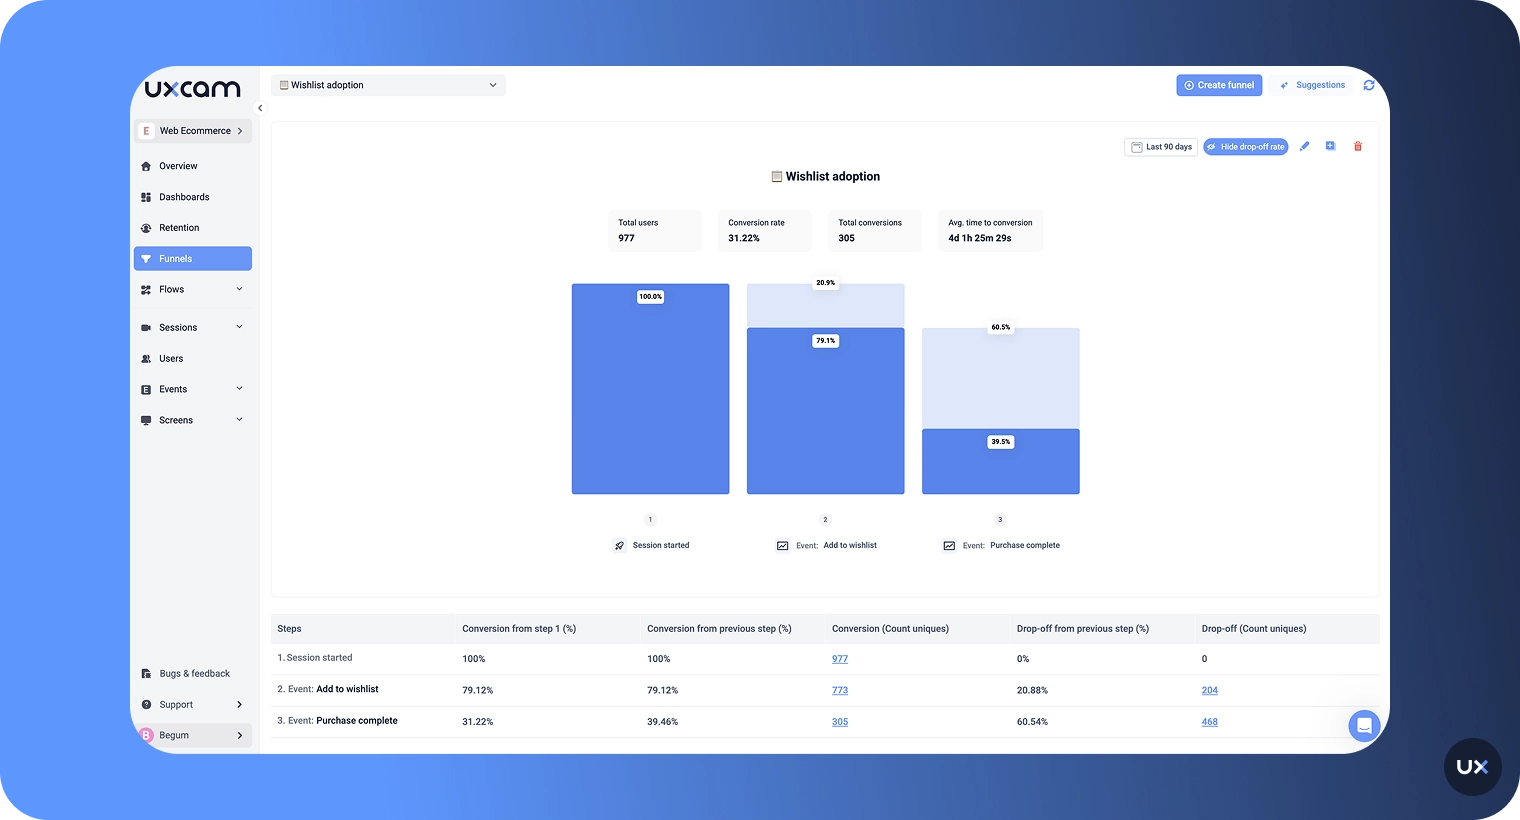
Leverage conversion funnels
A conversion funnel maps the steps users take to complete a goal. Track each stage to pinpoint where users drop off. If many leave at a specific step, you can investigate why, be it confusing content, lengthy forms, or slow load times.
A/B test for continuous improvement
Use A/B testing to compare different versions of a page or element, like headlines or calls-to-action. This helps you understand what resonates most with users. Remember, even small changes, like button colors or wording, can significantly impact conversions.
Set up custom alerts
Analytics platforms often allow you to set alerts for specific events, like traffic spikes or conversion drops. Custom alerts help you stay proactive, notifying you immediately if something needs your attention.
Use dashboards for quick insights
Build custom dashboards with your key metrics to see performance at a glance. This saves time, helping you track progress and make data-driven decisions faster. Dashboards also make it easier to share insights with your team.
Essential dashboard metrics by goal
Examples of dashboard metrics for various goals;
| Goal | Key metrics | Description |
|---|---|---|
| Increase engagement | Bounce rate, session duration | Indicates how well users engage and stay on your site |
| Boost conversions | Conversion rate, exit pages | Tracks success in driving users to complete actions |
| Improve traffic | Traffic sources, top pages | Reveals where users come from and which pages attract them |
| Optimize experience | Device type, user flow | Helps tailor the user experience based on device and journey |
Turn your data into actionable insights with UXCam
Web analytics isn’t just about tracking traffic, it’s about understanding people. By measuring how users interact with your website or app, you can uncover opportunities to improve usability and drive meaningful growth.
The key is to connect data with intent. Focus on the metrics that align with your business goals, choose the right analytics tools, and review your insights regularly. When used strategically, web analytics helps you make smarter, evidence-based decisions that directly impact your bottom line.
If you’re ready to take the next step, leverage UXCam to combine both quantitative and qualitative analytics for accurate data. From heatmaps and funnels to AI-driven insights, UXCam helps you see the why behind every click, scroll, or tap. Try UXCam for free today.
FAQs
Understanding web analytics FAQs
How does web analytics work?
Web analytics works by tracking user interactions through embedded tracking code on web pages. This data is then processed into meaningful reports that show patterns in user behavior, such as how users arrive at the site, where they spend time, and when they leave.
What are some best practices in web analytics?
Best practices in web analytics include setting clear goals, regularly reviewing data, segmenting audiences, and combining quantitative data with qualitative insights. It’s also important to ensure data accuracy and compliance with privacy regulations.
What are the key metrics in web analytics?
Key metrics in web analytics include traffic volume, bounce rate, average session duration, pages per session, and conversion rate. These metrics help evaluate how well a website engages visitors and drives desired actions.
What tools are used for web analytics?
Popular tools for web analytics include UXCam, Google Analytics and Adobe Analytics. These platforms provide detailed insights into user activity, helping teams improve content, design, and overall site performance.
What’s the difference between web analytics and digital analytics?
Web analytics focuses specifically on user behavior on websites, while digital analytics encompasses all digital touchpoints, including mobile apps, social media, and email campaigns. Web analytics is a subset of the broader digital analytics discipline.
You might also be interested in these;
Website Visitor Tracking - A Comprehensive Guide
Top 10 Digital Analytics Tools You Need to Know
Ultimate Website Optimization Guide: Must-Know Tactics
Website Analysis 101: How to Analyze for Peak Performance
AUTHOR
Tope Longe
Product Analytics Expert
CONTRIBUTORS


Ardent technophile exploring the world of mobile app product management at UXCam.
What’s UXCam?
Related articles


Website Analysis
Best Free Web Analytics Tools [2026]
Compare the best free web analytics tools for UX, product, and privacy. See why UXCam is the top choice for behavioral insights, compliance, and...
Jonas Kurzweg
Product Analytics Expert
Website Analysis
What is Web Analytics? Definition, Metrics & Best Practices
Discover what web analytics is, its definition, key examples, and the best tools to optimize your website's performance and user...
Tope Longe
Product Analytics Expert


Website Analysis
Website Heatmap - Ultimate Guide and Best Tools [2026]
Read the ultimate 2026 guide to website heatmaps: discover types, implementation, and the best heatmap tools to optimize user experience and site's...
Jonas Kurzweg
Product Analytics Expert