Customer Analytics Dashboard Examples and How to Use Them


Wondering how you can effectively use customer analytics dashboards?
Many mobile app developers struggle to meet customer expectations in a competitive market. Research shows that 86% of buyers are willing to pay more for a better user experience. This highlights the need for high-quality applications. However, only 1% of users feel that vendors consistently meet these expectations, showing a big gap in the market.
To address this challenge, customer analytics dashboards can help. These tools provide insights into user behavior, preferences, and problems, helping developers see how their apps are used. With this information, developers can create better experiences, improve features, and boost performance.
In this UXCam guide, we will explain what a customer analytics dashboard is and how to use it to improve mobile app success.
Helpful summary
Overview: This article discusses the importance of customer analytics dashboards in mobile app development, highlighting how they provide insights into user experience to meet customer expectations.
Why trust us: UXCam has helped over 37,000 companies, including Costa Coffee, where it significantly improved app registration rates by 15%.
Why it matters: Gathering insights into user experience is important for improving app performance and user satisfaction.
Action points: Implement a customer analytics dashboard to monitor user behavior, identify pain points, and optimize app features for a better user experience.
Further research: Explore different customer analytics tools, their features, and best practices for using dashboards effectively.
Why listen to us?
We have extensive experience in helping small businesses optimize customer analytics dashboards to understand user behavior and improve app performance. At UXCam, our work with clients like Placemakers, where we helped double their sales, demonstrates our platform’s ability to help small businesses.
We’ve also supported Housing.com in enhancing feature adoption by 20%, and Inspire Fitness increasing their in-app user activity by 460%.
This experience ensures that our clients can effectively use analytics dashboards to drive success.
What is a customer analytics dashboard?
A customer analytics dashboard is a tool that aggregates and visualizes data about your app users. Think of it as your command center, where you can monitor everything from user interactions to app performance.
One excellent example is UXCam's customer analytics dashboard. It's customizable and packed with features that help you understand your users better.


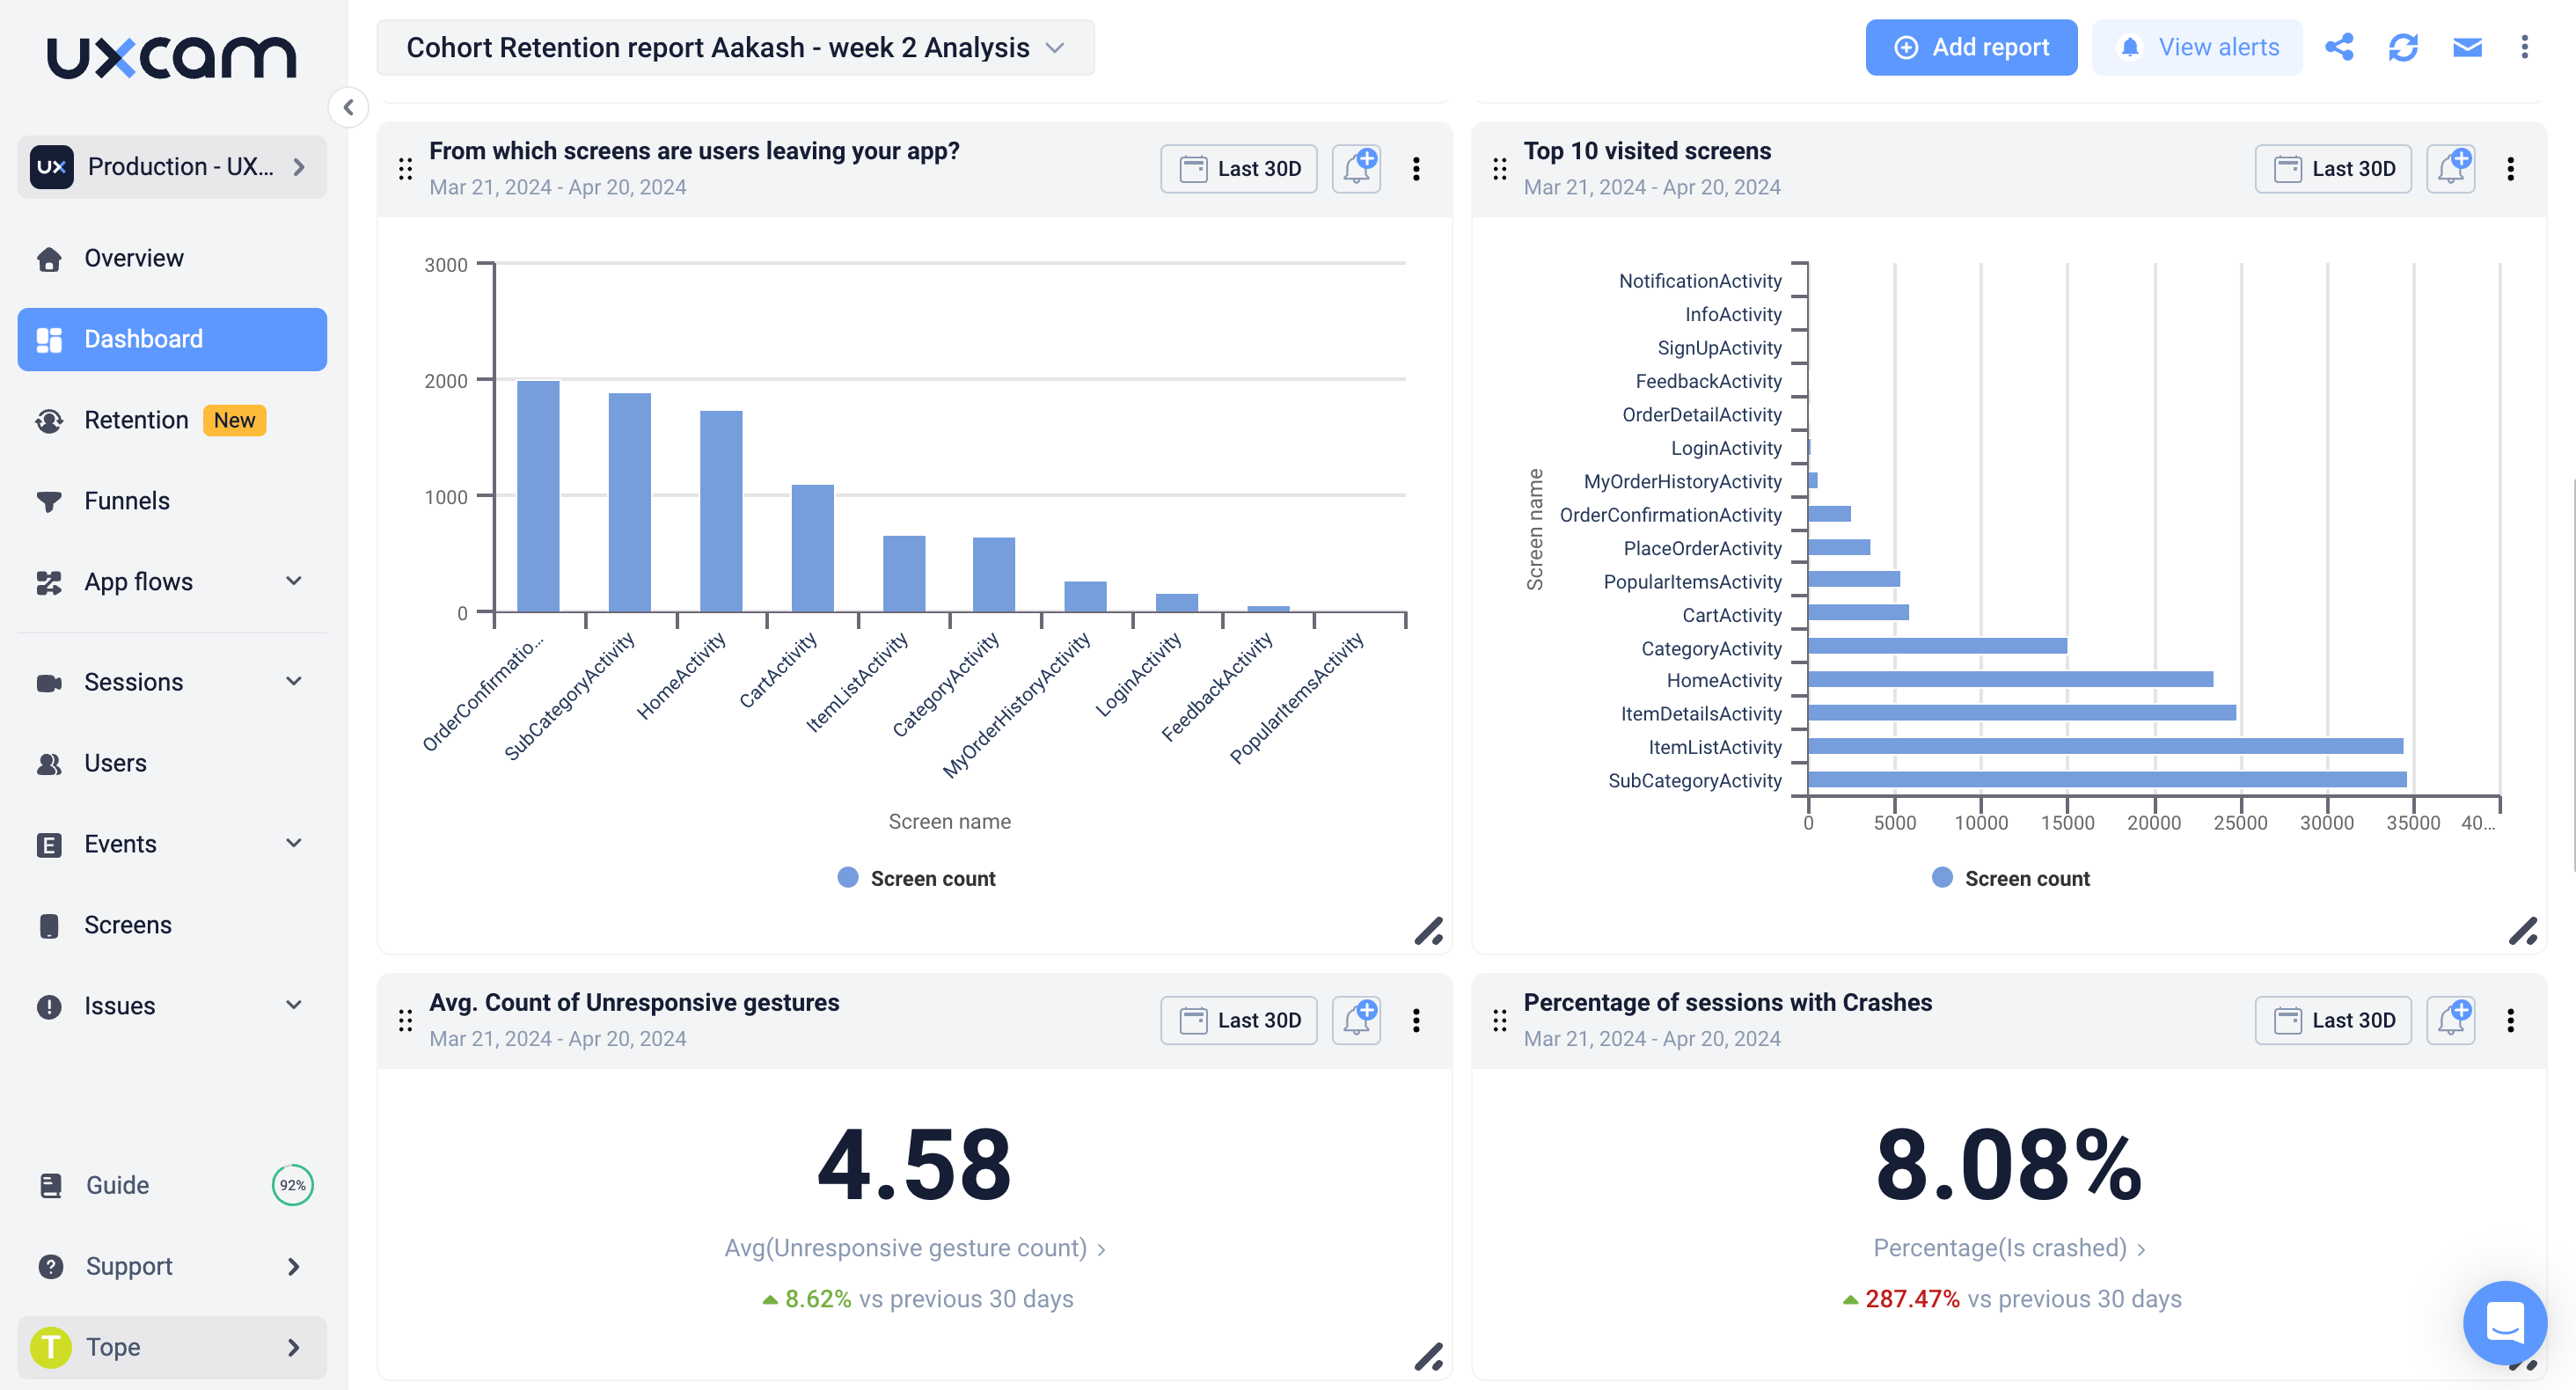
Key features of UXCam's customer analytics dashboard
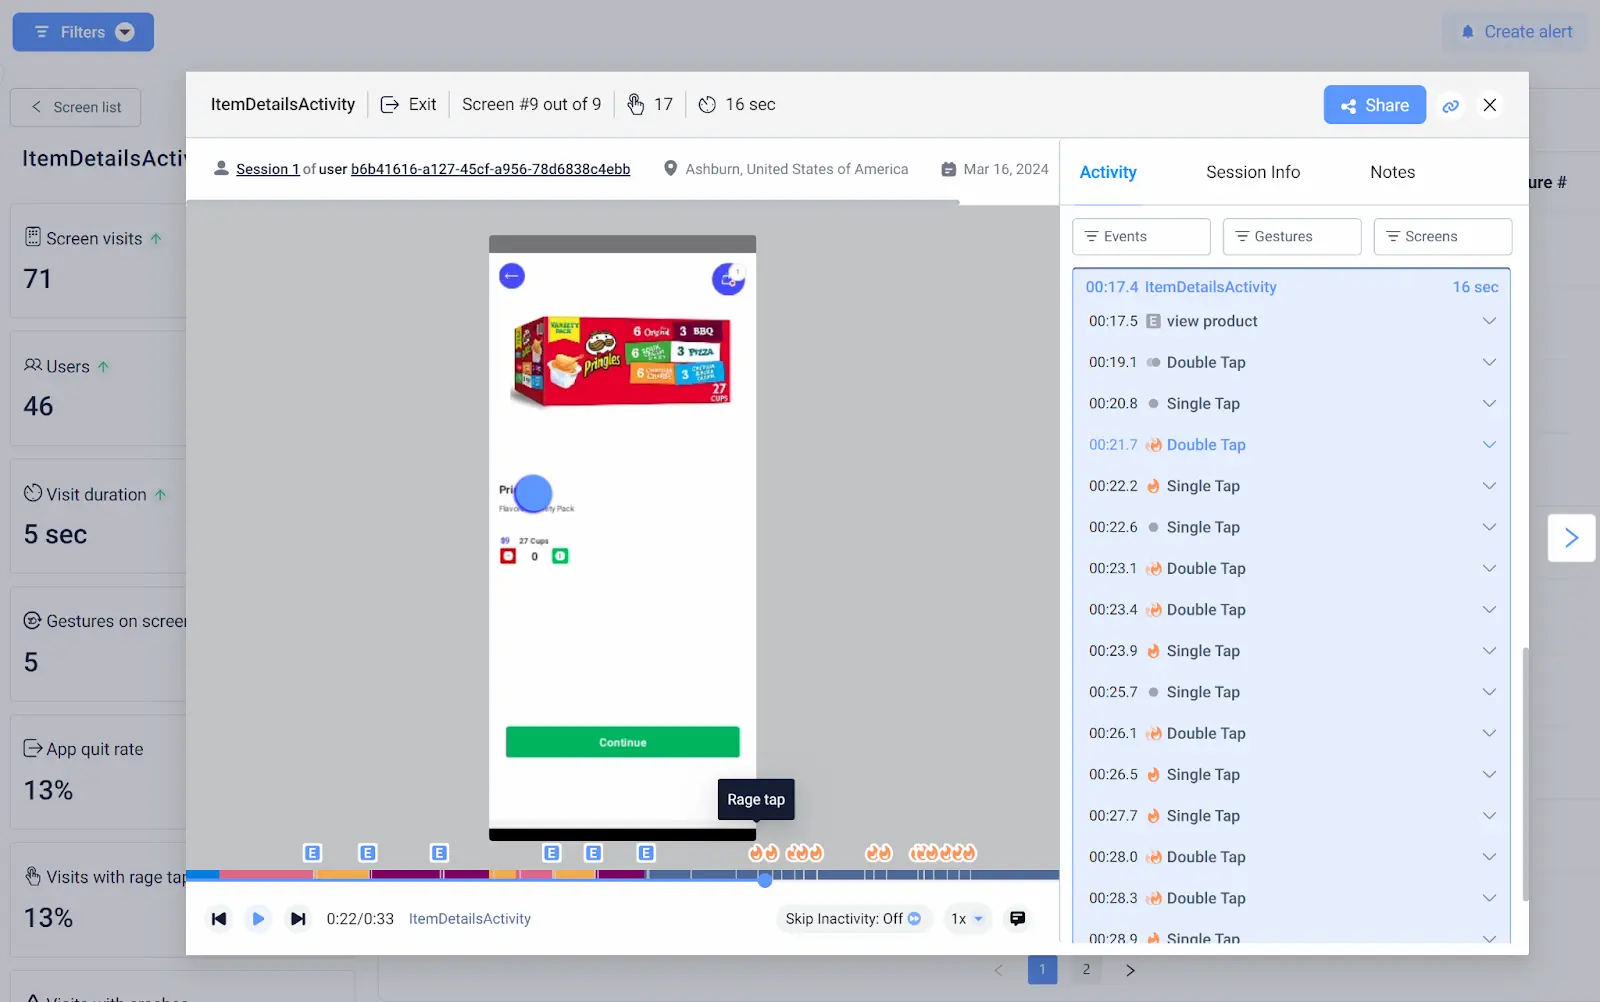
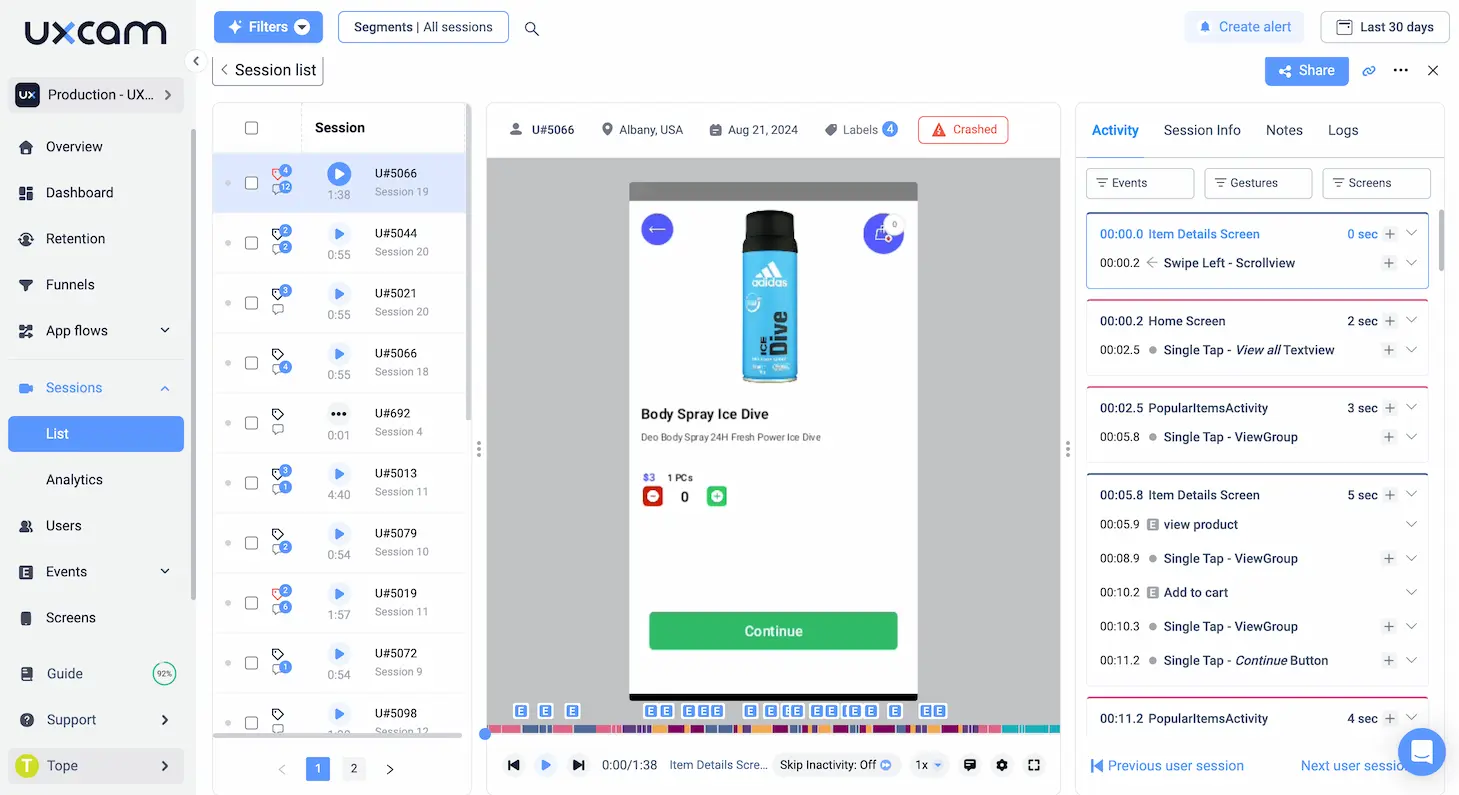
Session replay & analysis: UXCam records user sessions, allowing you to see exactly how users interact with your app. You can watch these sessions to identify usability issues and areas for improvement.
Heatmaps: These visual representations show where users are tapping, scrolling, and spending the most time. Heatmaps help you pinpoint areas of frequent engagement and potential problems.
User analytics: From funnels to rage taps, UXCam tracks detailed metrics about user behavior. You get a comprehensive view of how users navigate your app, where they drop off, and what frustrates them.
Case study
Let’s take a more detailed look at how UXCam’s customer analytics dashboard helped make one of our customer’s apps more successful.
UXCam helped the team at JobNimbus transform their mobile app by providing a customizable dashboard that tracked essential performance metrics. Prior to implementing UXCam, JobNimbus faced considerable challenges, including a high churn rate and a low app store rating of 2.5 stars. This was largely due to a poorly designed app that didn’t meet the needs of their users, who weren’t tech-savvy.
By implementing UXCam, the team was able to monitor key metrics such as user feature adoption rates, monthly active users, and device model distribution. These valuable data insights allowed the product team to make more informed decisions and adjustments to their product roadmap.
For example, they noticed a surge in adoption rates for specific features, which showed them that they needed to focus their development strategy on those features. Using session recordings they could also see exactly how users were interacting with these features.
Ultimately, after 18 months of dedicated efforts supported by UXCam's analytics capabilities, the JobNimbus team successfully increased their adoption rates from 0.51% to 25% within just 4 weeks. This also led to an increased app rating of 4.8 stars.
Importance of customer analytics dashboards
Understanding your users is a huge part of mobile app success. A customer analytics dashboard helps you gather valuable data that can shape your app's future.
Enhancing user experience
By watching session replays and analyzing heatmaps, you can identify pain points and make necessary adjustments. This leads to a smoother, more enjoyable user experience.
Boosting engagement
With detailed insights into user behavior, you can make data-driven decisions to boost user engagement. This means more active users and higher retention rates.
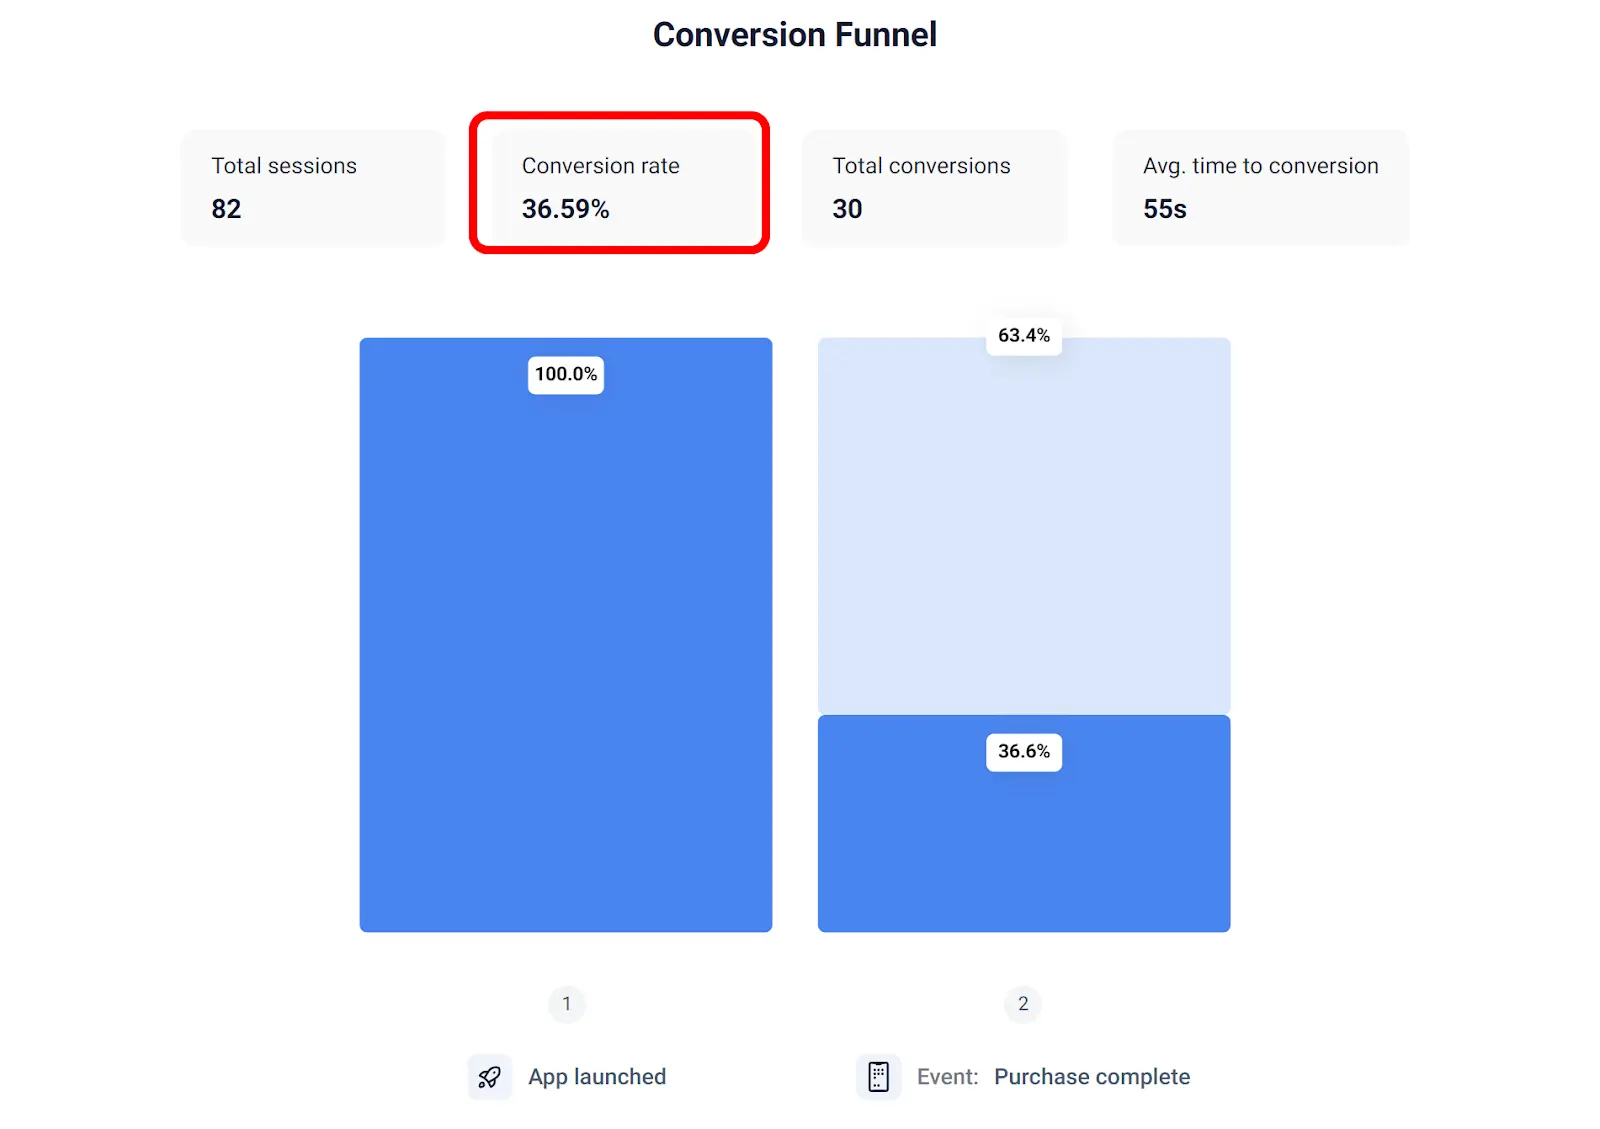
Optimizing conversion rates
Funnel analytics show you where users drop off in their journey. By understanding these bottlenecks, you can make changes to optimize conversion rates and improve your app's success.
How to maximize your customer analytics dashboard
Once you have a customer analytics dashboard, you need to make sure you’re using it effectively. Here are some tips to make the most out of your dashboard:
Regularly monitor user sessions
Make it a habit to watch user sessions regularly. This helps you stay updated on how users interact with your app and quickly identify any issues.


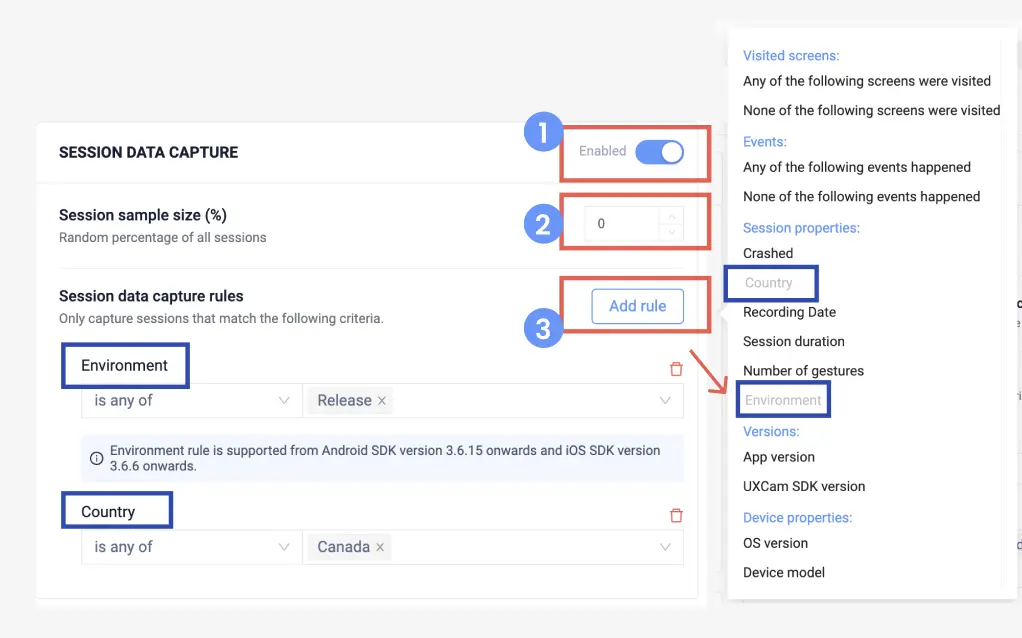
With UXCam, you can customize session recording settings according to your needs. You can set parameters such as:
The sampling rate (record every session or a percentage)
Specific screens or events
Privacy settings (like blurring sensitive data)


Analyze heatmaps
Use heatmaps to see where users are engaging the most. Look for patterns and areas with high activity. This information can guide your design and content decisions.
With UXCam, you can visualize areas of high activity, indicated by warmer colors such as red and yellow. This helps you identify key zones where users frequently interact. The data collected reveals natural focal points on a screen, allowing for strategic placement of important elements like call-to-action buttons, forms, or links.
For instance, if users consistently tap on a specific area that lacks functionality, adding an interactive element there can capitalize on existing user interest. Conversely, areas with minimal interaction might indicate that certain features or content are unnecessary. You can then remove or de-emphasize these elements for a cleaner user interface.


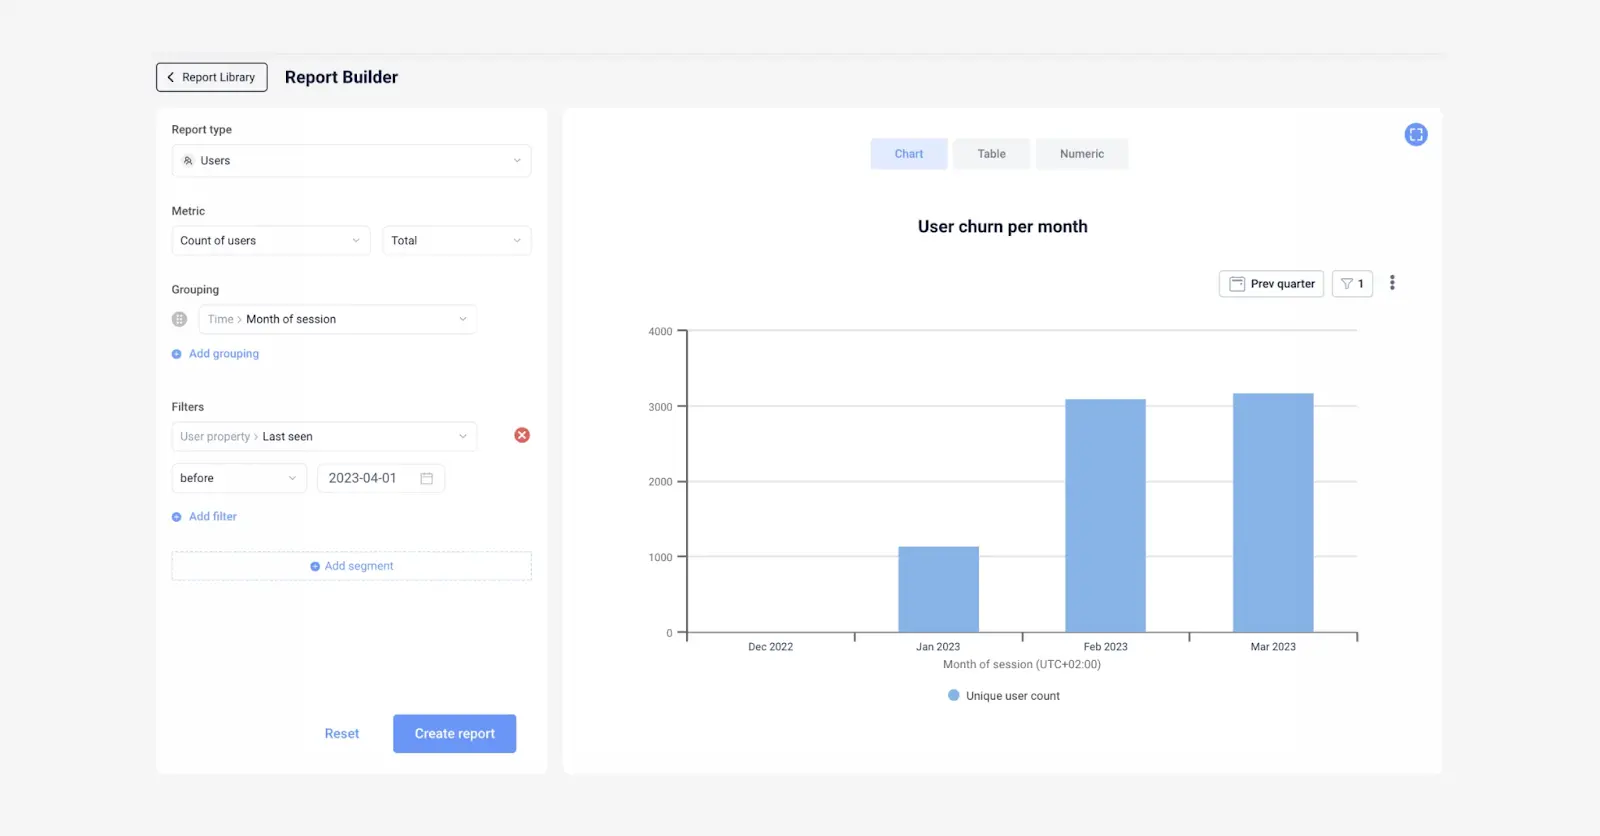
Track key metrics
To effectively measure your app’s success, it’s essential to define clear Key Performance Indicators (KPIs). These specific metrics will provide valuable insights into how users are engaging with your app and whether it is meeting its objectives.
With UXCam's customer analytics dashboard, you can gain insights into the following key KPIs:
User engagement rates: Reflect how actively users are interacting with your app.


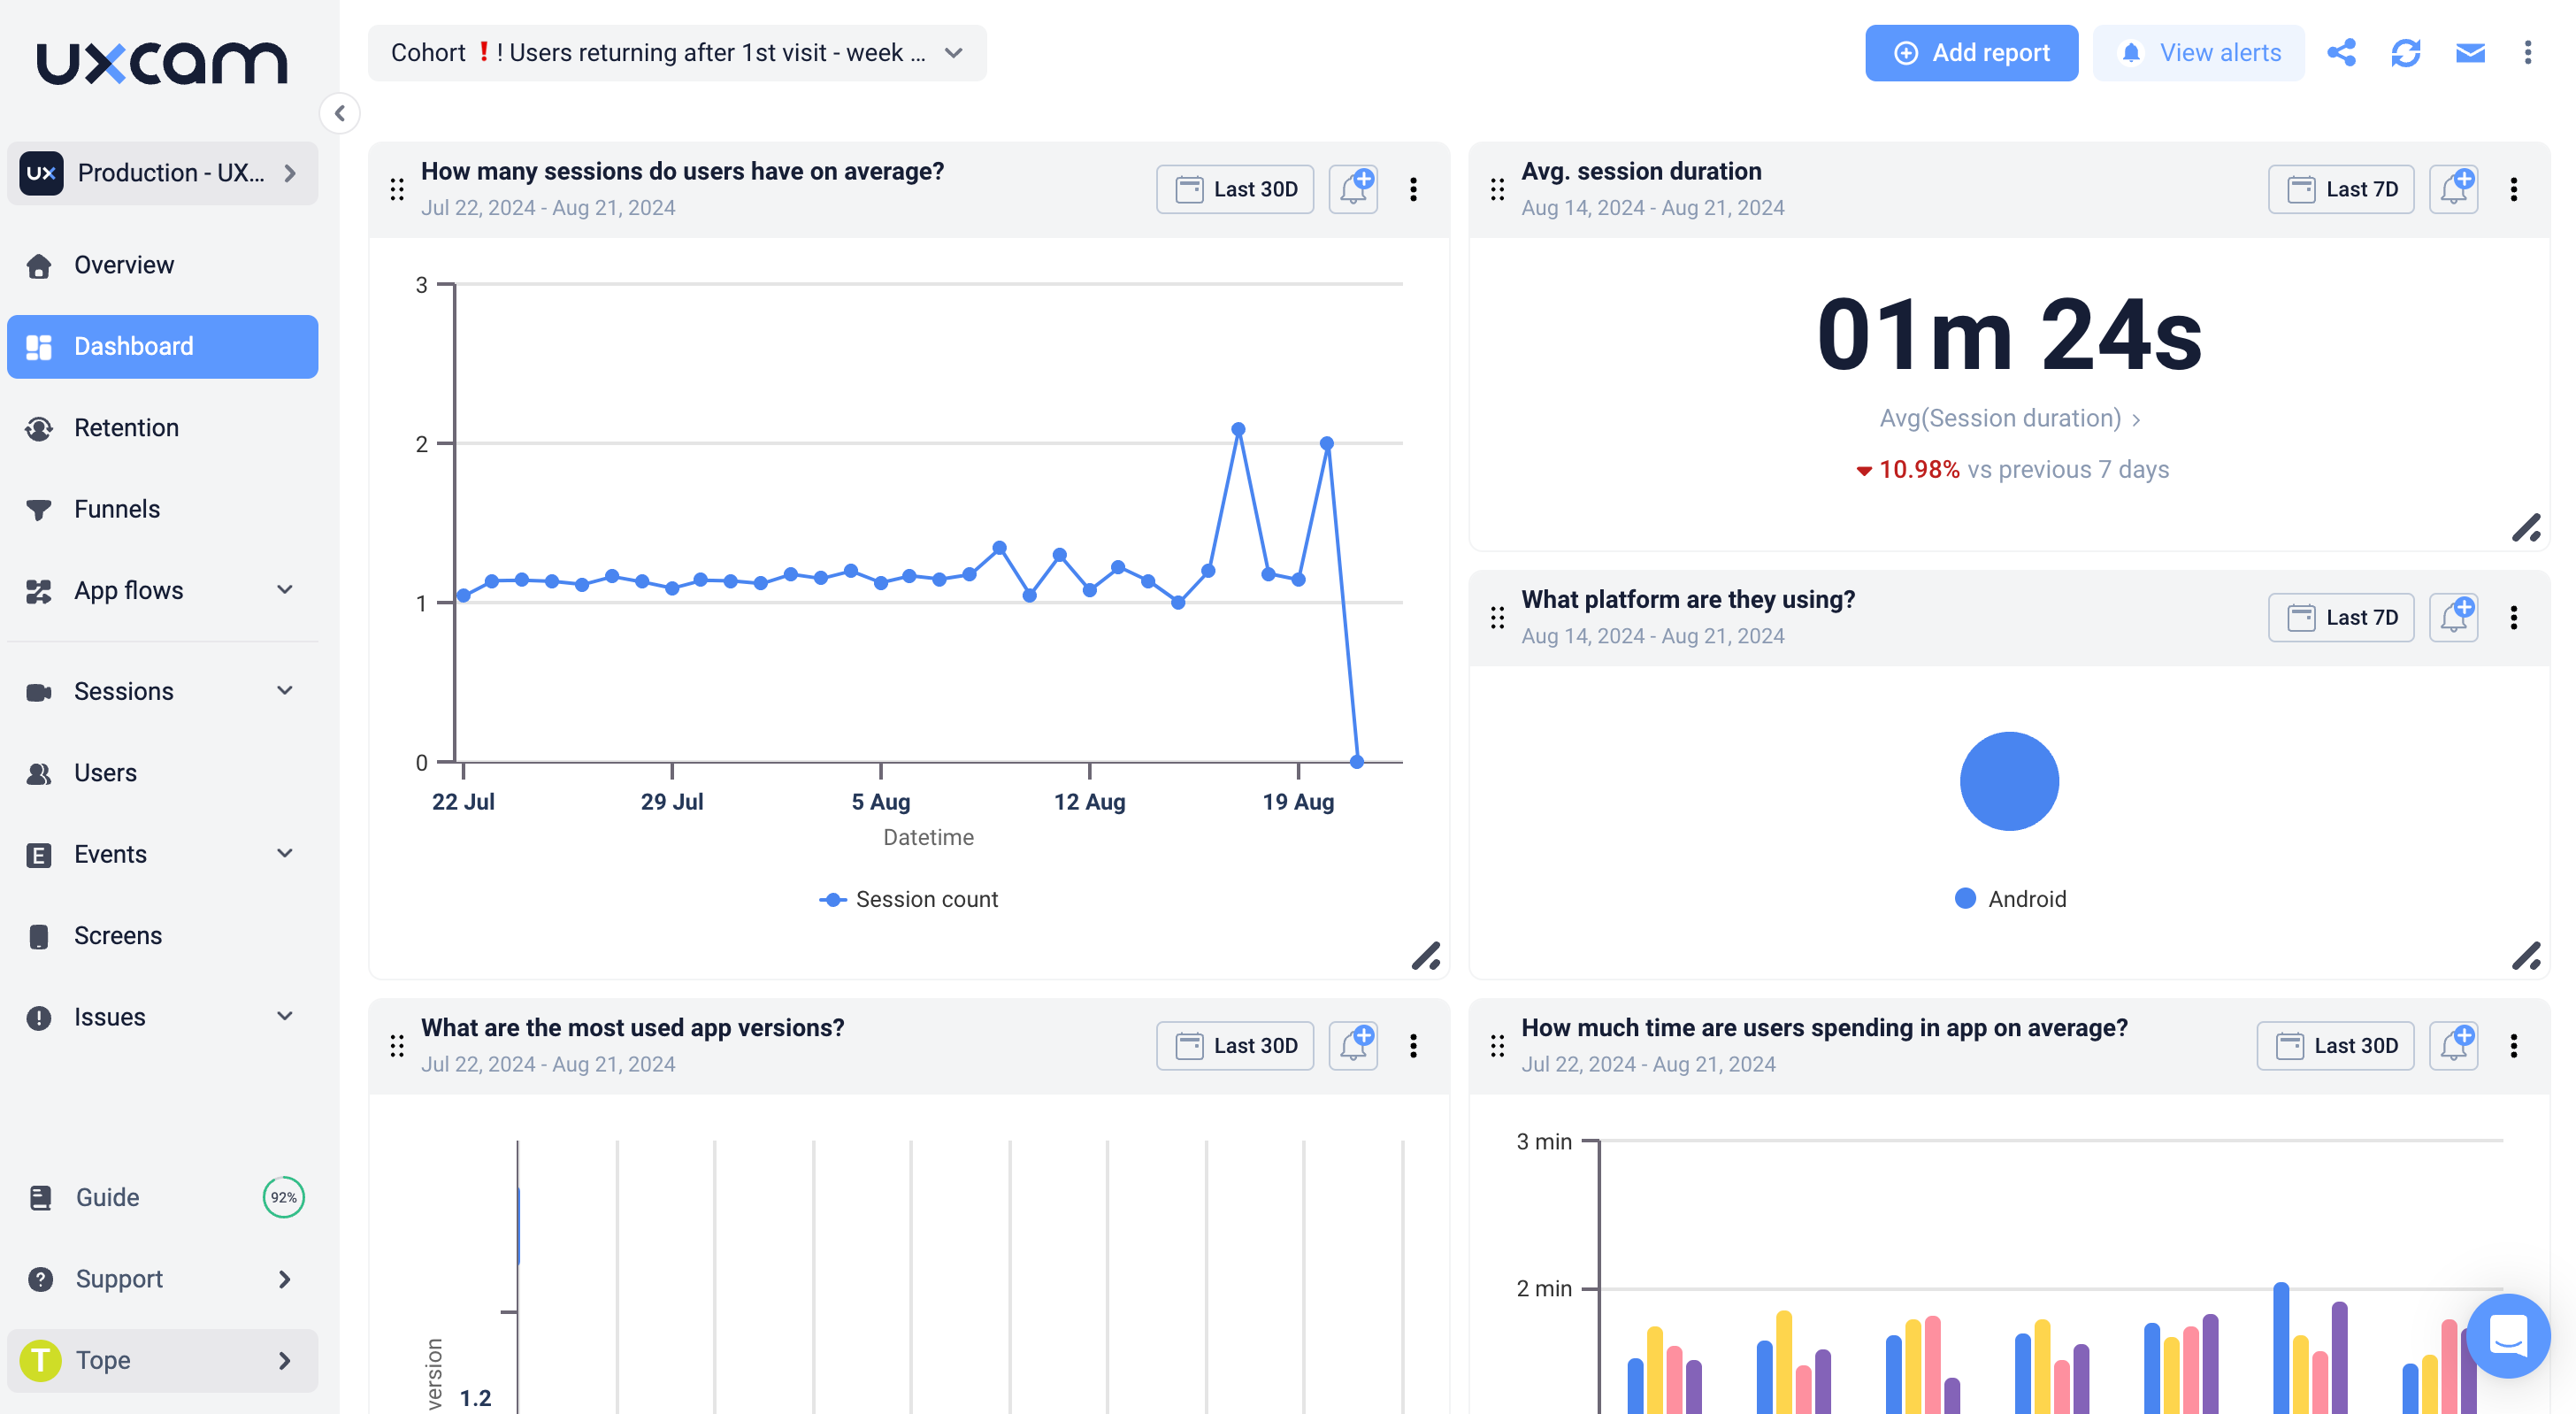
Session duration: Indicates how long users spend in the app per visit


User retention: Demonstrates the percentage of users who return to the app over time


Conversion rate: Measures the percentage of users achieving desired actions (like making a purchase or signing up).


Churn rate: Shows the rate at which users stop using the app.


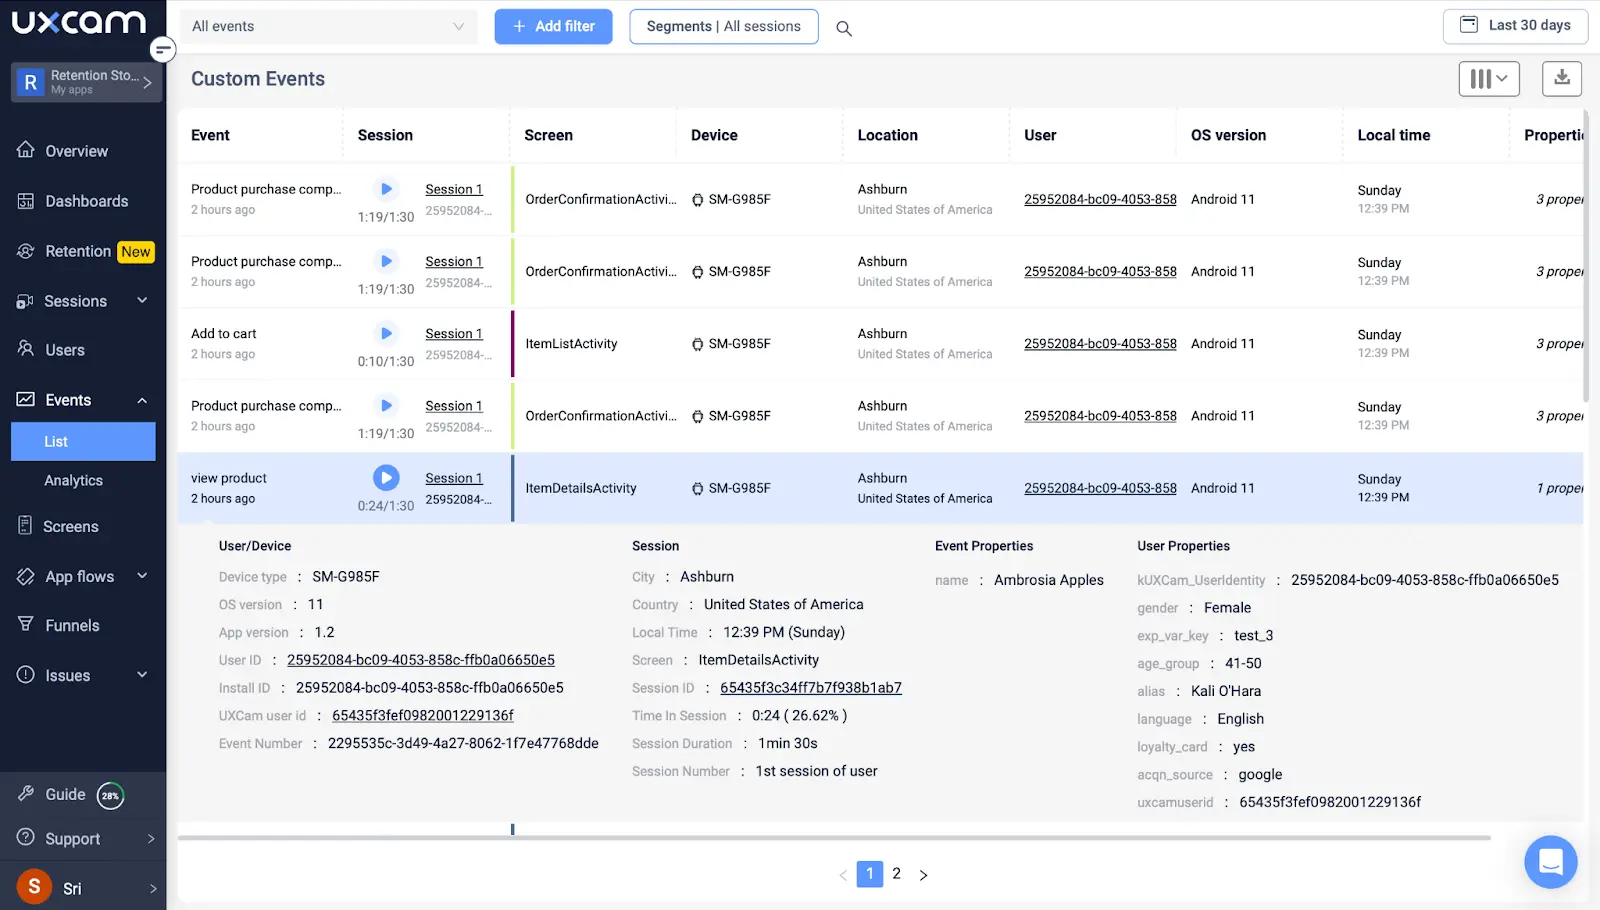
Event tracking
In addition to tracking KPIs, you can set up custom events within your app. These events capture specific user actions, providing deeper insights into user behavior and preferences. Common event tracking elements include:
Button clicks: This reveals which features attract user interest the most.
Page views: This shows the flow of navigation within the app.
Form submissions: This showcases how effectively input fields are used.


Best practices for using your customer analytics dashboard
These are the best practices that you can use to get the most out of your customer analytics dashboard.
Keep it simple
Focus on the most important metrics and avoid getting overwhelmed with too much data. Simplify your dashboard to display only the most relevant information.
Create actionable reports
Generate reports that provide actionable insights. Share these reports with your team to ensure everyone is working towards the same goals.
Continuously improve
Use the insights from your dashboard to make continuous improvements. Regularly update your app based on user feedback and data-driven decisions.
Conclusion
A customer analytics dashboard is a powerful tool for mobile app developers. It provides valuable insights that can be used to boost engagement, increase user satisfaction, and optimize conversion rates.
With our in-depth session replays and heatmaps, UXCam is an excellent choice.
It’s time to take your mobile app to the next level. Try UXCam for free and see the difference an advanced customer analytics dashboard can make for your app.
You might also be interested in these;
Conversion Funnel Analysis - A Comprehensive Guide
E-commerce Customer Analytics - How to Drive Growth With Data
Customer Journey Visualization - A Step-by-Step Guide
12 Best Customer Analytics Tools and Software
Event Based Analytics - What it Is And How to Set It Up
4 Best Customer Insights Tools and Software
AUTHOR
Tope Longe
Product Analytics Expert
Ardent technophile exploring the world of mobile app product management at UXCam.


Related articles


App Analytics
Top 19 Mobile App Analytics Tools in 2026
Choosing the best mobile app analytics tools and platforms for your app can be overwhelming. We did the research, so you don't have...


Jonas Kurzweg
Product Analytics Expert


App Analytics
Best Android App Analytics Tools in 2026
Discover the top 8 Android analytics including UXCam, Firebase, and Flurry Analytics. Compare features, pricing, and platforms...


Annemarie Bufe
Product Analytics Expert
Curated List
Top 19 Mobile App Analytics Tools in 2026
Discover the top mobile analytics tools in 2026. Compare features, pricing, and reviews to choose the right platform for app tracking, behavioral insights, and data-driven...
Jonas Kurzweg
Product Analytics Expert