Back to blog
6 MIN READ
How to analyze session recordings
PUBLISHED
19 June, 2024

Product Analytics Expert
Whether you’re a seasoned session replay user or a total newbie, we’re providing everything you need to know about analyzing with this qualitative research tool.
Session replay tools generate vast amounts of data, capturing every user interaction, so there’s an overwhelming amount of information to get lost in. But if you follow this guide, the volume of data will work for you rather than against you.
Here’s what we don’t want you to do with session replay — we don’t want you to feel like you need to sit there and watch hundreds of sessions until you find a needle in a haystack.
There’s a method to the madness and we’re going to show you how to get insights fast and efficiently from session replay. If you already have an analytics tool like Mixpanel or Google Analytics, that doesn’t have session replay, you can integrate it with a session replay tool like UXCam.
How session data is collected
Before we get into the nitty gritty goal setting and tips on how to analyze session replay, let’s align on how session data is collected. If you don’t understand how sessions are collected, you won’t understand the data, so you won’t be able to analyze it. And that’s what we’re all here for aren’t we?
What is a session and how is it recorded? A session begins recording when someone opens the app and it stops recording when that session gets interrupted, either through a phone call, a text message, the app gets them to the background, the app crashes, or the app is forced to quit or the app is calling another API.
If your app includes processes that require the use of other applications to be completed e.g. login with Facebook, take and upload a photo, scan a code, etc. you can use an Allow short break API to avoid having the session split. Here’s some further reading if you want to learn more about Allow short break API.
Your mobile app analytics tool may generate a schematic representation on your app to visualize in-app behavior, without recording your app’s screen. The schematic replay technology reconstructs the session by drawing rectangular shapes and texts in a way that reflects the app’s actual screen layout.
UXCam always generates schematic representations for iOS to help customers comply with Apple’s privacy guidelines. It’s a great option if you want to hide all the images on the screen in case your app has privately identifiable information (PII).
Sessions are uploaded to UXCam soon after the app is sent to the background unless there is a connection issue. If there is a connection issue, we save it to the user’s device in order to upload the next time they use your app.
Understanding the sessions data
So now let’s get into the sessions themselves. Below is a screenshot of UXCan’s session replay tool open.
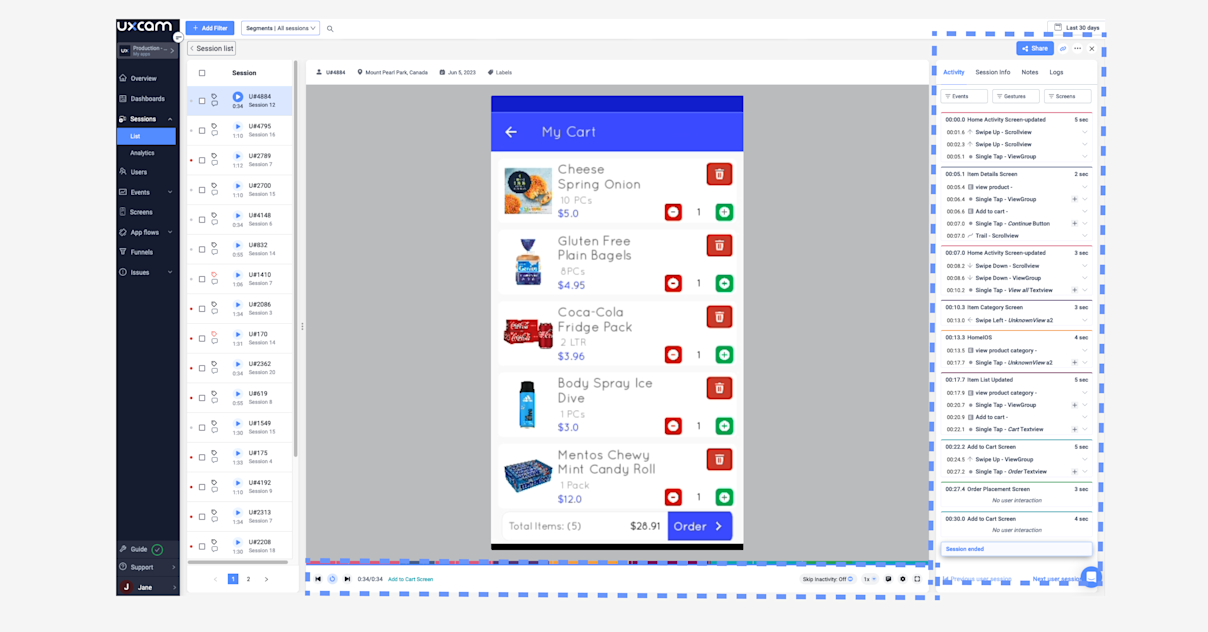

On the left you have a list of all your sessions listed based on the filters that are set. If there are no filters then you’ll just have all sessions.
On the right, you’ll see the session timeline, a wealth of information related to the session you’re watching, including Activity, Session Info, Notes, and App Logs. In Activity, you’ll see the screen names, gestures, session times. In the session info you can see all the metadata that’s being collected. Now, meta data and session information is important because we’re collecting all the information in the backend about what users are doing, what device they're doing it on and around the user as well. This will be handy when you are filtering for sessions to narrow down which videos to watch. And Logs will come in handy when you have to tell your customer support or engineering team more context of what happened and what you want to fix.
You can filter on all of this information because of course we don't want you to go through a tedious amount of sessions We want you to understand what you're looking for pretty quickly here.
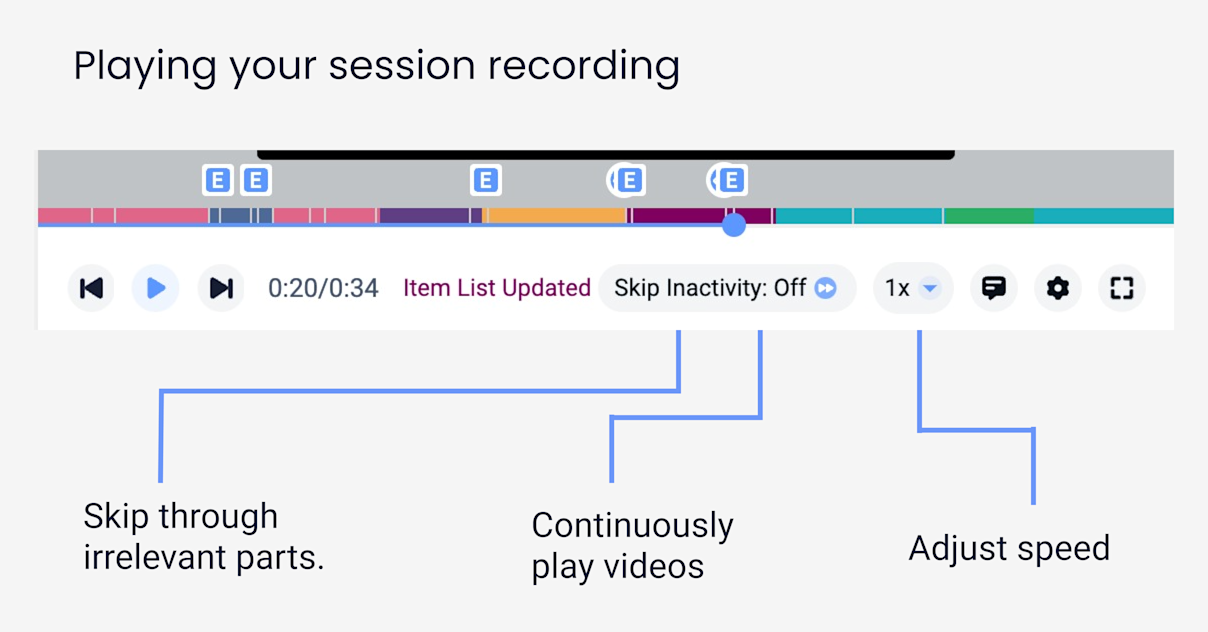

Over to the session recording video itself. At the bottom, you’ll see a player which will help you navigate through the sessions. The skip inactivity button means you only play the parts that have user interaction. The play all button enables you to continuously play sessions so you don’t have to continue clicking on the next session.
Find a mobile app analytics tool that lets you share your sessions, either publicly or not. Let your team know exactly what your user did in this case e.g. a bug, a conversation, UI issues, crashes.
Preparing for your analysis
The first step is to know your goals and metrics beforehand so you don’t get lost and end up just going down the rabbit hole watching videos. If you don’t know where to start, there are 2 approaches. You can let the data define your team goals or use your company wide goals.
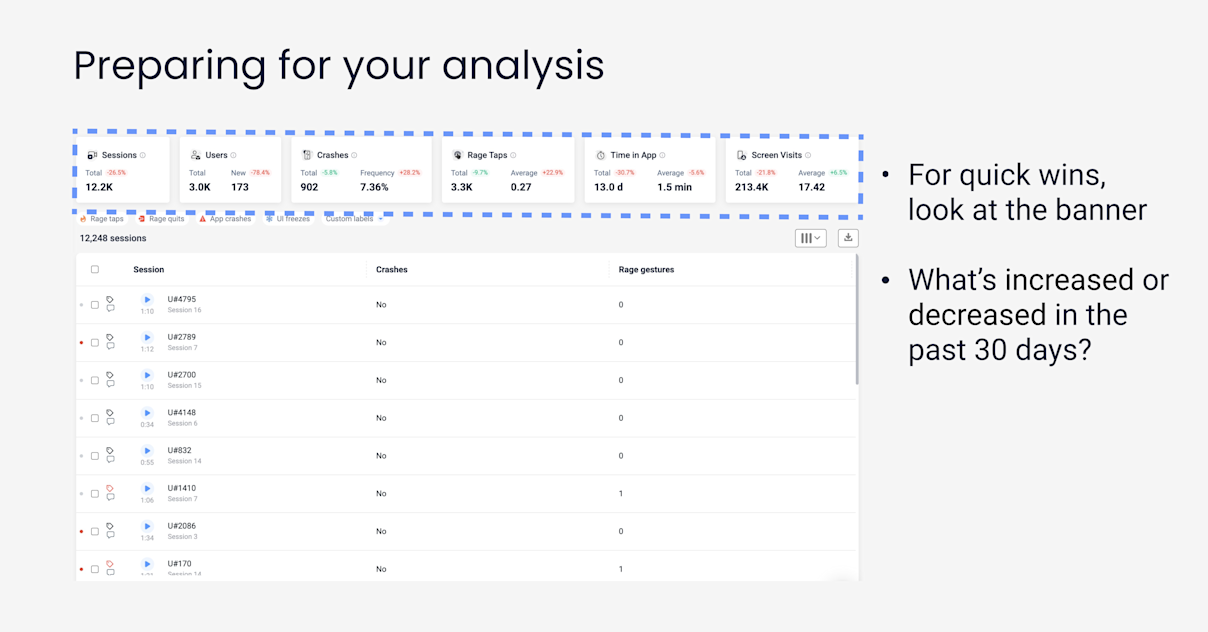
Data Defined Goals: Start with your session statistics. If you’re using UXCam, go to Sessions > Lists or Sessions > Analytics. At the banner on the top, you can see top stats. Simply look to see what has increased or decreased in the last 30 days.
You can see whether crashes have increased, rage taps have increased, or average time an app has decreased, probably because of these crashes. This tells you to prioritize looking into reducing crashes.
You can go into Issues > Crashes, dig into what’s happening the most, and go into a session replay for that crash.. Once you find the problem, copy the log, download the replay, and share it with your team to fix.
The banner offers you a quick win.

Company goals: We have a whole section on defining success in our help center. But most of the time, we tell UXCam customers to lean towards company goals.
You’ll have hard data to show the impact you’re making on the overall company (and you’re more likely to get promoted). If you want more of a scientific framework with metrics before and after, we say go for the HEART framework.
Filter the data based on your goals
Use filters based on the goal that you have. Here are some examples of how you can translate goals into filters:
If your goal is retention, filter for time in app
If your goal is stability, filter for crashes and UI freezes
If your goal is to improve on the user experience, filter for rage taps
If you still don't know where to begin within the banner itself, you can use the dashboards and look through the reports here and get an idea of where to start.
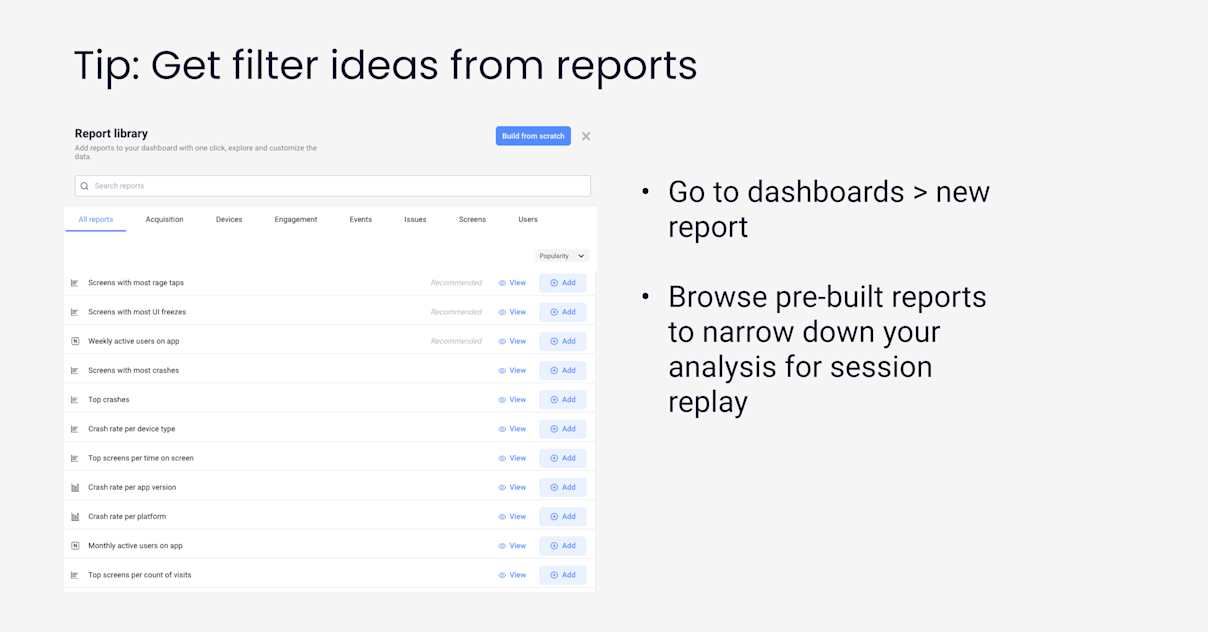

If you want to see if you have more crashes on iOS or Android, look at crash per platform
If you want to see if you have more crashes on different models, filter for crash rate by device type. What type of devices do your users use in general? You can find out which devices crash the most.
If you want to see if your conversion screens are causing problems, you can look at screens with the most rage taps
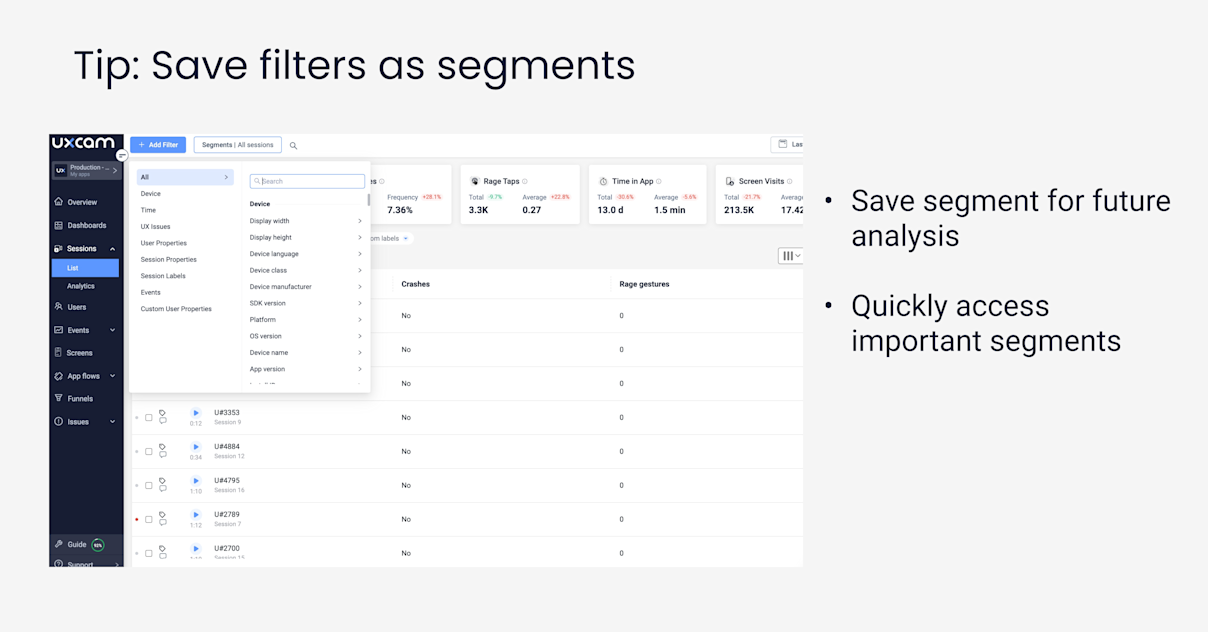
During a user behavior analysis, segmentation helps you save filter sets so you can analyze the same data set in the future. For example, you just launched a new app version, to see how it’s performing, you may want to save this as a segment:
all users on that new app version
all crashes
all users that went to a specific screen

Using session recordings with other analytics features
When you combine heatmaps with session replay, you can get a deeper understanding of user behavior, validate hypotheses, and find the why behind user’s actions in the app. Heatmaps help you understand the most important UX elements for each screen, entry and exit points, and specific gestures that are the most popular.
With session recordings you can see the user’s actions before they leave the app, e.g. went from category, to an item page, to the checkout before quitting. But examining the same session on heatmaps, you can see which elements the user clicked on before quitting the app.
This powerful combination can help you identify what made the users leave and the frustrating UI element that caused it. To see the heatmaps of which pages users quit on, you can go to Screens > Filters > Next Screen > Exit
Beyond exits, you can also filter by things like app version, platform, device class - and analyze the heatmaps. Filtering for the app platform is great if you have 2 different teams (e.g. iOS and Android team) and want to check how your latest app version performed on each respective platform.
Other qualitative and quantitative tools can enhance your session replay analysis. Instead of watching all sessions on a single app version, you can slice up your data with other features.
Conclusion
One last thing we didn’t mention about session replay, is if you’re using UXCam, all sessions are automatically captured once you integrate the UXCam SDK into your app. This single line of code enables you to sit back and wait for the data to roll in before your analysis. If you’d like to try out session replay totally free with no strings attached, sign up for a free 14 day trial and access all our features.
AUTHOR

Jane Leung
Product Analytics Expert
CONTRIBUTORS
Jane is the director of content at UXCam. She's been helping businesses drive value to their customers through content for the past 10 years. The former content manager, copywriter, and journalist specializes in researching content that helps customers better understand their painpoints and solutions.
What’s UXCam?
Related articles
Session Replay
Mobile Session Recording - The Complete Guide 2026
Why session replay is such a valuable feature, and what you should look out for when starting...

Annemarie Bufe
Product Analytics Expert
App Analytics
The Hotjar for mobile apps: UXCam
Read on to learn about the best Hotjar alternative for native mobile apps (Android and iOS) and hybrid apps. Here's how to get heatmaps and session recordings for your mobile...

Audrey Meissner
Session Replay
Best Visitor Recording Software Tool for Web Apps - UXCam
Discover the best visitor recording tool for web apps—UXCam. Get session replays, event analytics, and deep insights to optimize user experience. Try it...

Tope Longe
Product Analytics Expert

