How to Find Active Users of an App


Not sure how many people are really using your app? You’re not alone.
A lot of product and growth teams struggle to measure active users accurately. And when you don’t have a clear view of who’s engaging with your app, or how often, it’s nearly impossible to improve retention, fix drop-offs, or prioritize the right features.
The result? Missed insights, wasted development time, and stalled growth.
This guide will help you fix that. We’ll break down what “active users” actually means, how to define it for your app, and how to track it the right way. You’ll also see how UXCam makes it easy to uncover user behavior patterns, so you can build a better product, grow faster, and make smarter decisions—backed by data.
Let’s get into it
Why listen to us?
At UXCam, we have firsthand experience helping development and product teams understand and improve their mobile app experiences for their users. Clients using our solutions have recorded significant improvements in their user metrics.
For example, we helped Costa Coffee increase app registrations by 15% and JobNimbus boost its adoption rates by 25% in a month.
Summary - Tracking app daily active users
| How to find the active users of an app | Description |
|---|---|
| Choose the Right Product Analytics Tool | Select UXCam for comprehensive tracking and integration. |
| Define Your Active Users | Define active users by frequency and specific actions. |
| Track Active Users | Monitor DAU, WAU, MAU, and user actions. |
| Set Up Continuous Monitoring | Continuously monitor segments and analyze trends. |
What are active users?
Active users are unique users engaging with an app within a specific period. Product teams use this metric to measure mobile app analytics KPIs like engagement, growth, churn, and product stickiness.
It’s important to note that the definition of an “active” user can vary depending on your app’s nature and goals. For some apps, simply opening the app might count as an activity, while others may require specific actions like making a purchase or posting content.
Why tracking your app’s active users is important
Measuring app health
Active user metrics are vital to your app’s overall performance. Tracking daily, weekly, and monthly active users gives you a comprehensive view of user engagement levels. This data helps you identify trends, spot potential issues early, and assess the impact of updates or changes.
Guiding product development
Understanding your active users’ behaviors is important for informed product development. By analyzing which features are used most frequently and how users navigate your app, you can prioritize improvements and new features that cater to your most engaged audience.
Predicting revenue
Whether your monetization strategy involves in-app purchases, subscriptions, or advertising, engaged users are more likely to contribute to your bottom line. You can more accurately forecast future earnings by correlating active user data with revenue metrics.
Benchmarking against competitors
Understanding how your active user metrics compare to industry standards and direct competitors is important as it allows you to gauge your app’s market position and identify areas for improvement.
How to find the active users of an app
Define what “active” means for your app
Choose the right product analytics tool
Monitor active user trends
Segment your users for deeper insights
Optimize based on actionable insights
Step 1: Define what “active” means for your app
To start finding your active users, you need to get clear about how you're going to measure activity in the first place. Here’s exactly how to do that:
Choose your “active” metric
The first step to measuring active users is deciding how often you expect users to engage with your app. This depends entirely on your app’s purpose and typical user behavior.
Here are the three common ways apps measure activity:
Daily Active Users (DAU): Users who open and interact with your app every day. For example, apps that provide daily value, like messaging, news, or social media apps.
Weekly Active Users (WAU): Users who interact with your app at least once a week. For example, fitness tracking, meal planning, or productivity apps.
Monthly Active Users (MAU): Users who interact at least once a month. For example, travel booking, financial apps, or subscription services.
To choose your metric, ask yourself these simple questions:
How frequently should my users ideally return to my app?
Does daily engagement matter, or is weekly/monthly usage more realistic?
Pick the metric that matches your app’s purpose and usage patterns. For instance, if you have a language-learning app, daily or weekly engagement makes sense. But if you have an app for booking holiday trips, monthly engagement could be sufficient.
Identify key actions that represent meaningful activity
Once you've chosen how frequently you measure active users, the next step is to decide what counts as meaningful activity within your app. This is crucial because just opening an app isn’t always enough to say a user is truly engaged.
You need to clearly identify specific actions users perform that genuinely show they're finding value. Think about your app and answer these questions:
What specific things do active users do in my app?
Do they log in regularly?
Do they complete important tasks, like placing an order or filling out a form?
Do they frequently interact with key features, like watching a video, uploading content, or sharing something?
How much time spent in the app shows true engagement?
Is a quick visit meaningful, or does spending several minutes indicate better engagement?
For example, if your app helps people learn to meditate, maybe meaningful activity means users completing a 10-minute meditation session. If your app is for online shopping, meaningful activity might be browsing products and making a purchase.
Take a moment to list the top 2–3 actions that clearly show users are genuinely engaged. This will guide exactly what you track and analyze moving forward.
Set baseline goals to track your progress
The final step in defining your metrics is to set clear, measurable goals. Goals help you quickly see if your app is successfully engaging users or if you need to make adjustments.
For example, a clear and simple baseline goal might be:
We want 70% of new users to still be actively engaging (weekly) after their first month.

Or, you might say:
At least 50% of users should use our main feature at least twice per week.
Having a goal makes your measurement meaningful and actionable. You’ll instantly know if you’re on the right track or if your app needs improvement.
Ask yourself right now:
What’s a realistic goal for my active user rate based on my app’s current performance?
What timeframe makes sense for tracking this goal (daily, weekly, monthly)?
Write down your goal clearly, and revisit it regularly as your app evolves. By clearly defining how you measure active users, identifying key actions, and setting baseline goals, you've laid a strong foundation for understanding user engagement. Next, you'll need to implement analytics tools (like UXCam) to track these metrics easily and reliably, helping you gain deeper insights into user behavior.
Step 2: Choose the right product analytics tool
Once you've defined what an active user means for your app, the next move is setting up a system that can actually track that behavior. Without the right analytics in place, you're working in the dark. You're relying on assumptions, not evidence and that leads to wasted time, missed opportunities, and poor decisions.
This step is about turning your active user definitions into real, usable data—and doing it in the fastest, clearest, and most insightful way possible.
That’s exactly where UXCam comes in.


Why UXCam is the smartest way to track active users
You don’t need another tool that gives you charts without context or dashboards that look impressive but don’t lead to action. You need answers, fast. You need to understand how users behave, where they drop off, and what’s working. That’s why UXCam is built differently.


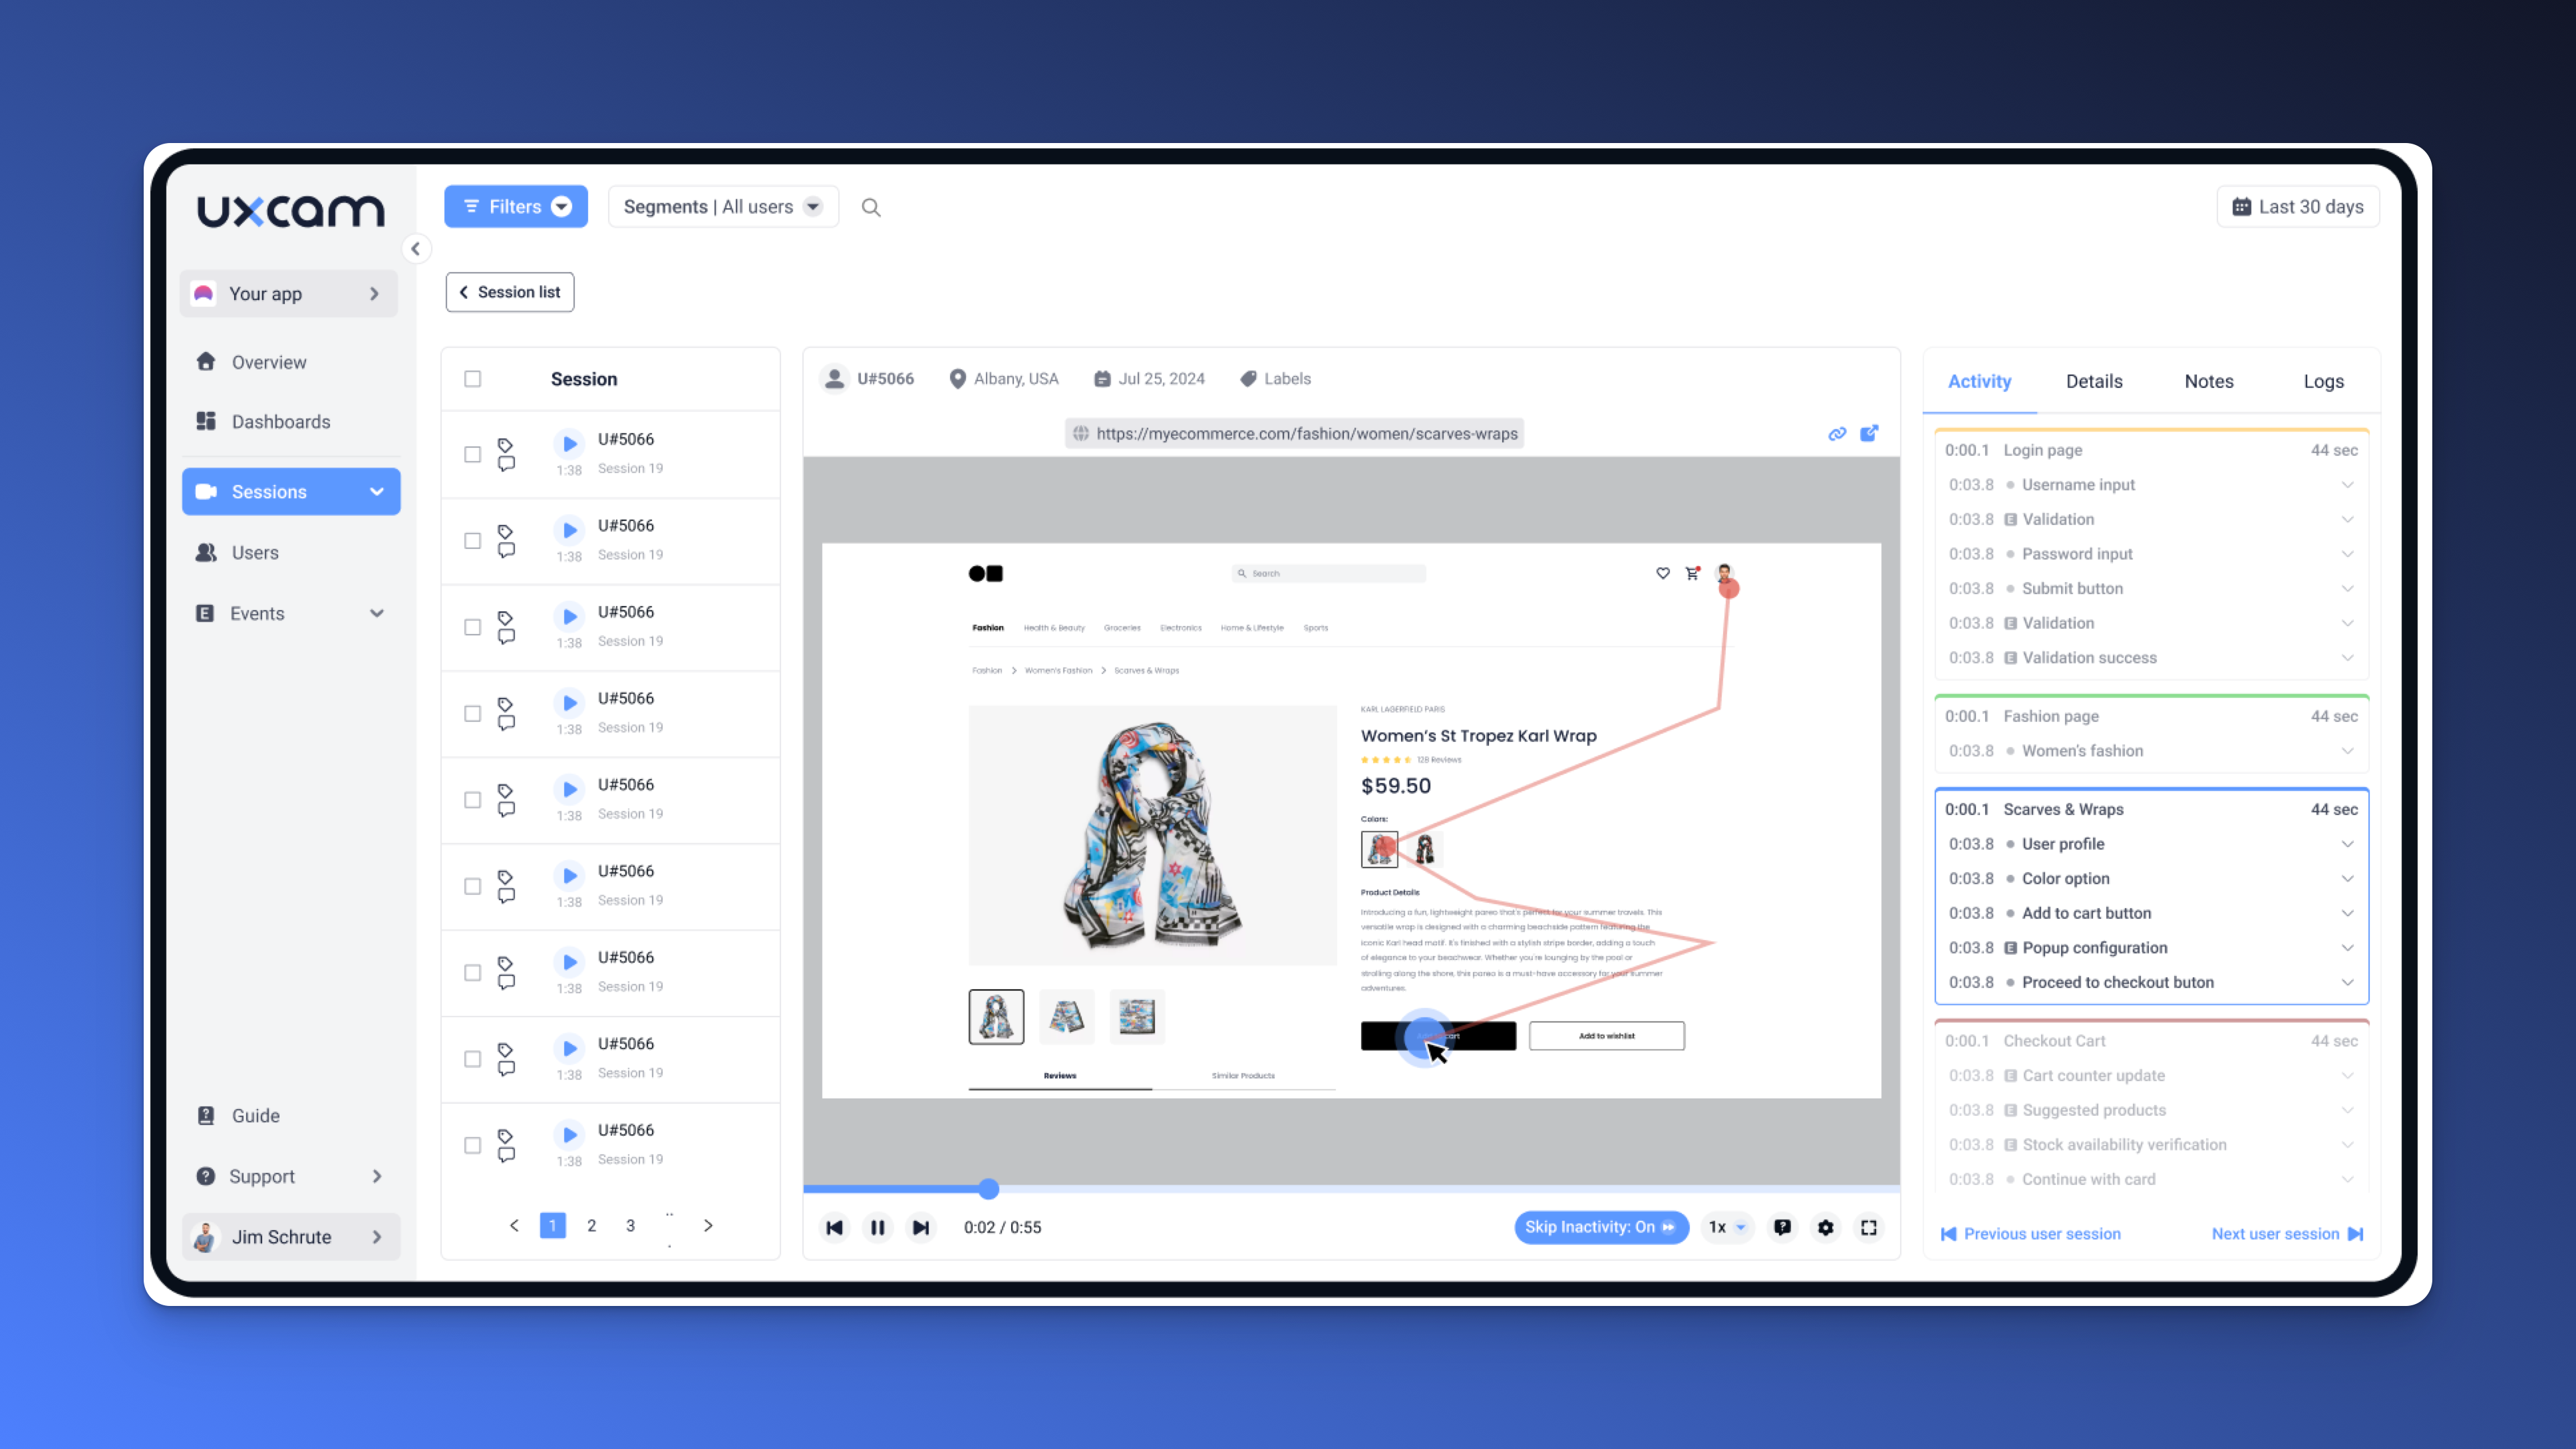
1. You see what your users actually do
Most analytics tools show you the “what.” UXCam takes it up a notch to show you the “why.”
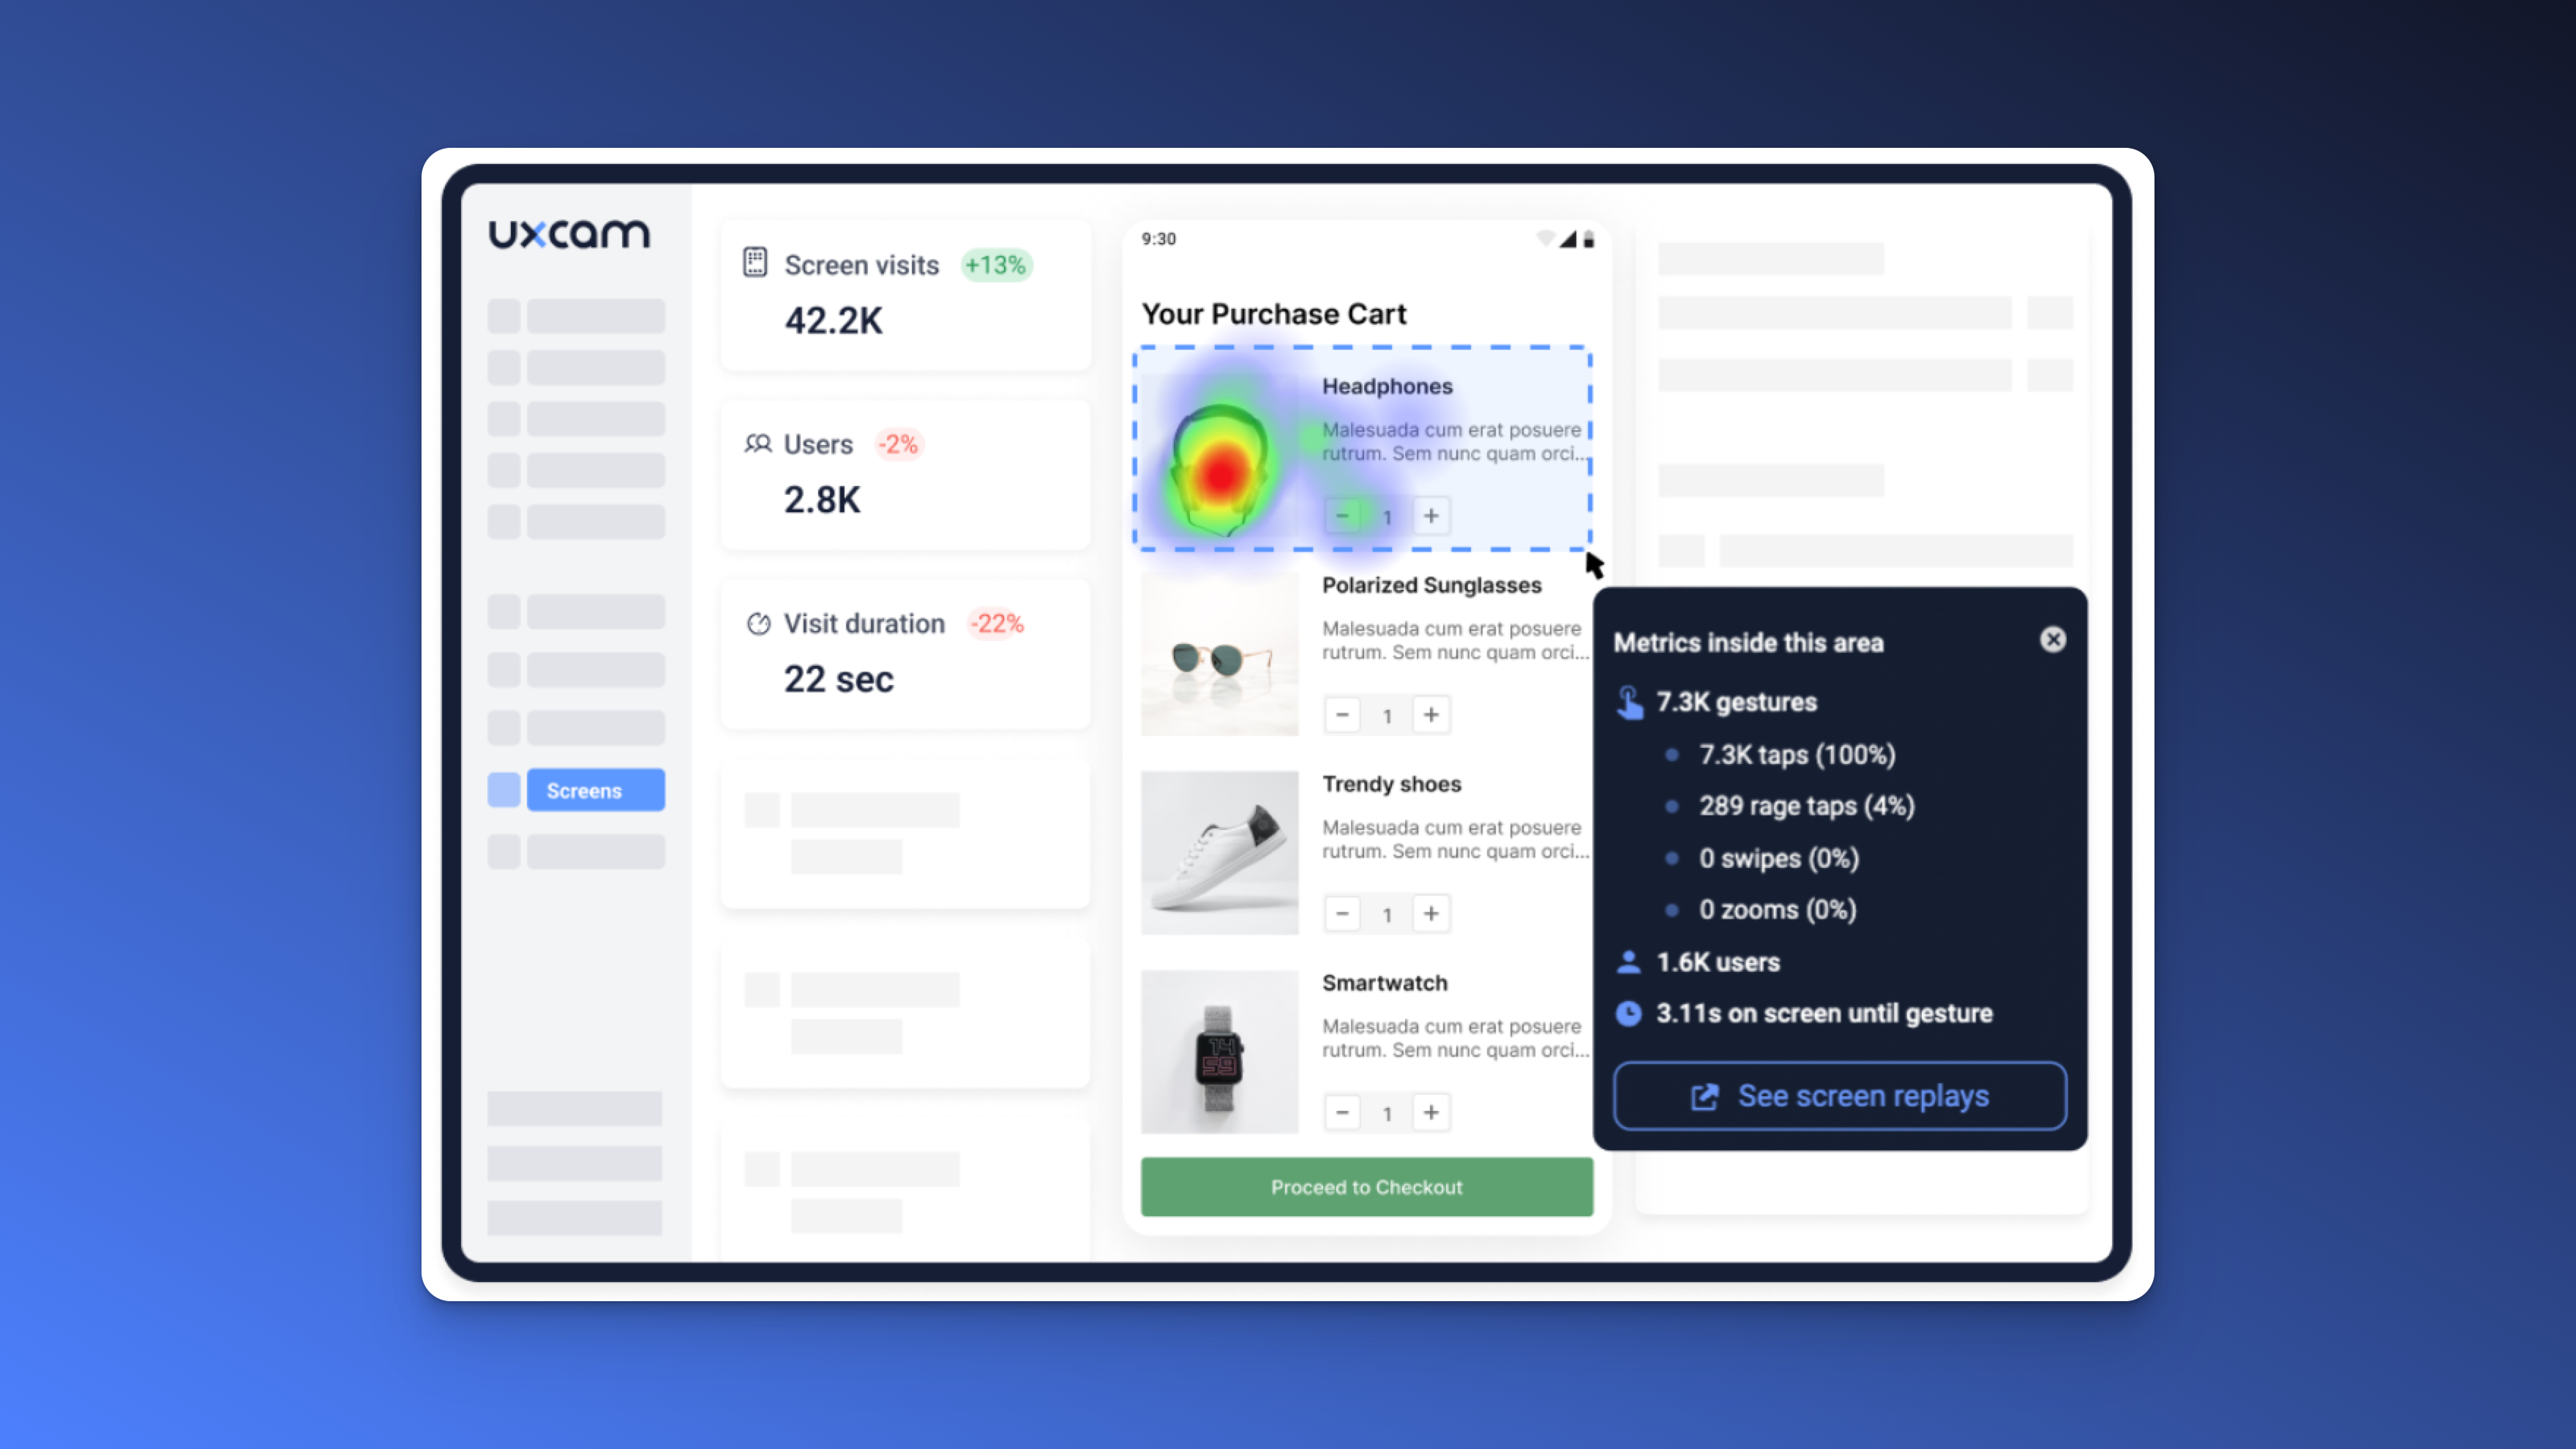
With session recording and heatmaps built into our product analytics solution, you’re not guessing why a user dropped off, you’re watching it happen. You can see where they tapped, where they got stuck, and how they moved through each screen. No guessing. No assumptions. Just clear, visual proof of what’s really going on.


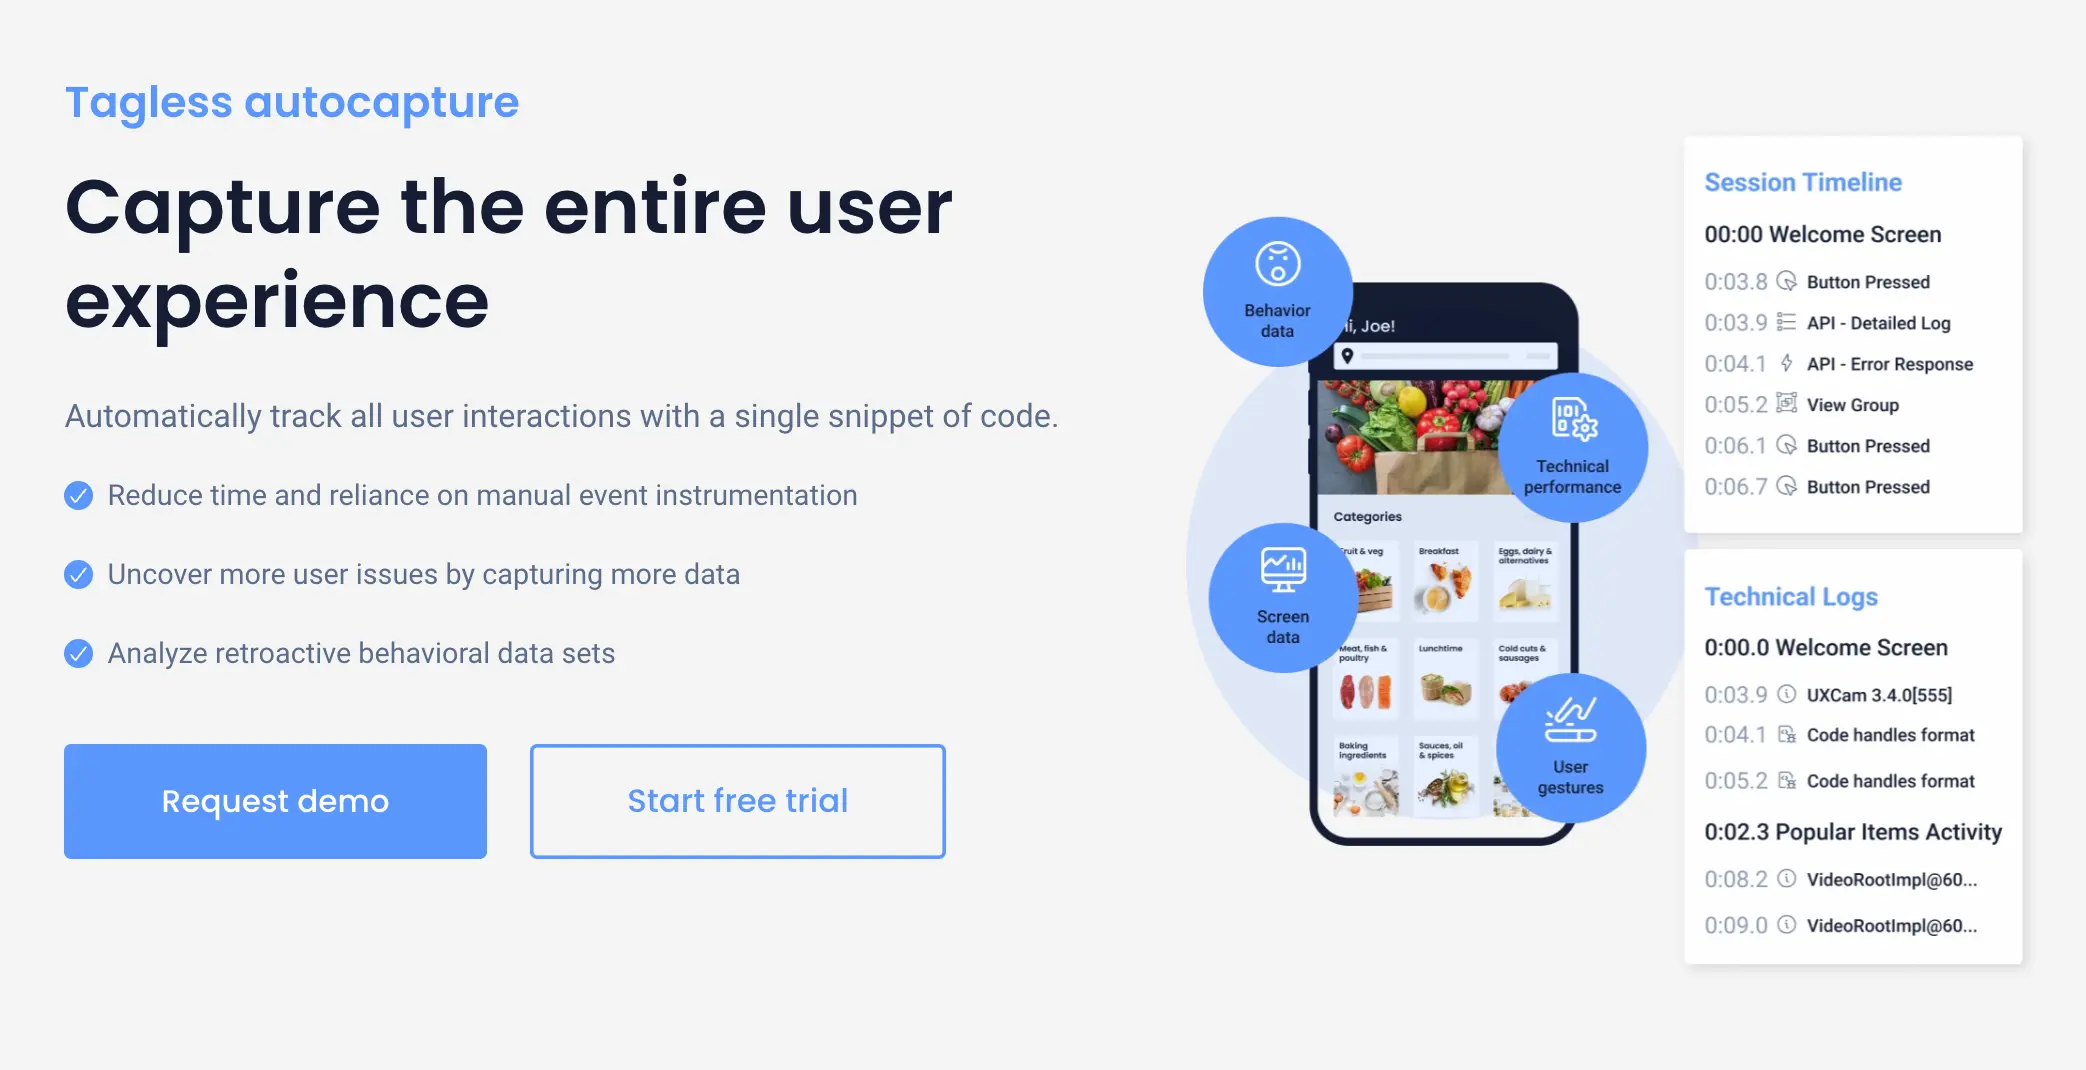
2. You get instant insights without manual setup
UXCam’s autocapture means you're collecting the most important interactions the moment you install it—no need to tag every screen or manually configure events. It’s perfect for teams that want to start learning right away instead of spending weeks setting up.
And this matters when you're trying to identify active users. Because you're not just looking for numbers, you’re looking to understand behaviors. UXCam captures it all without slowing you down.


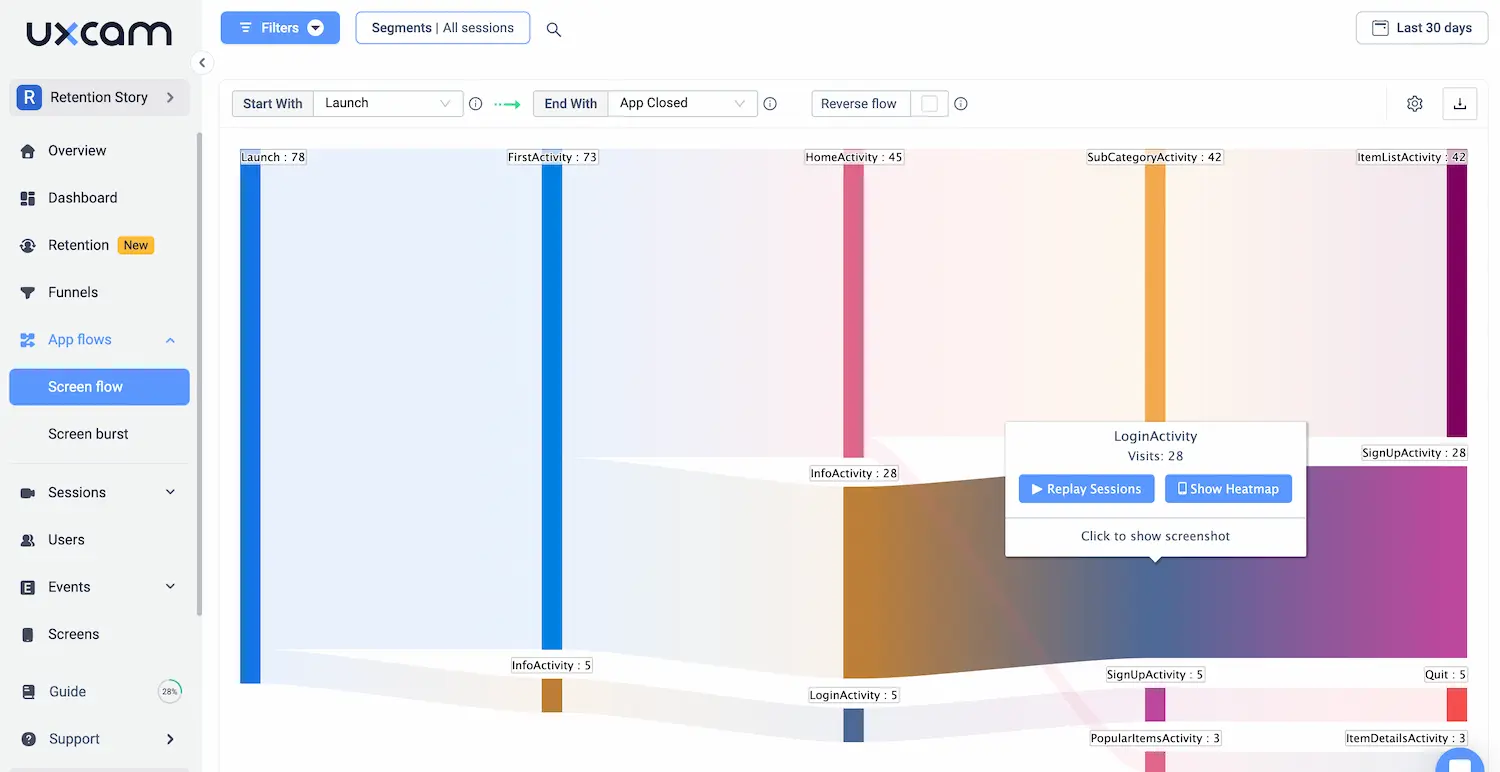
3. Easily understand user journeys and retention
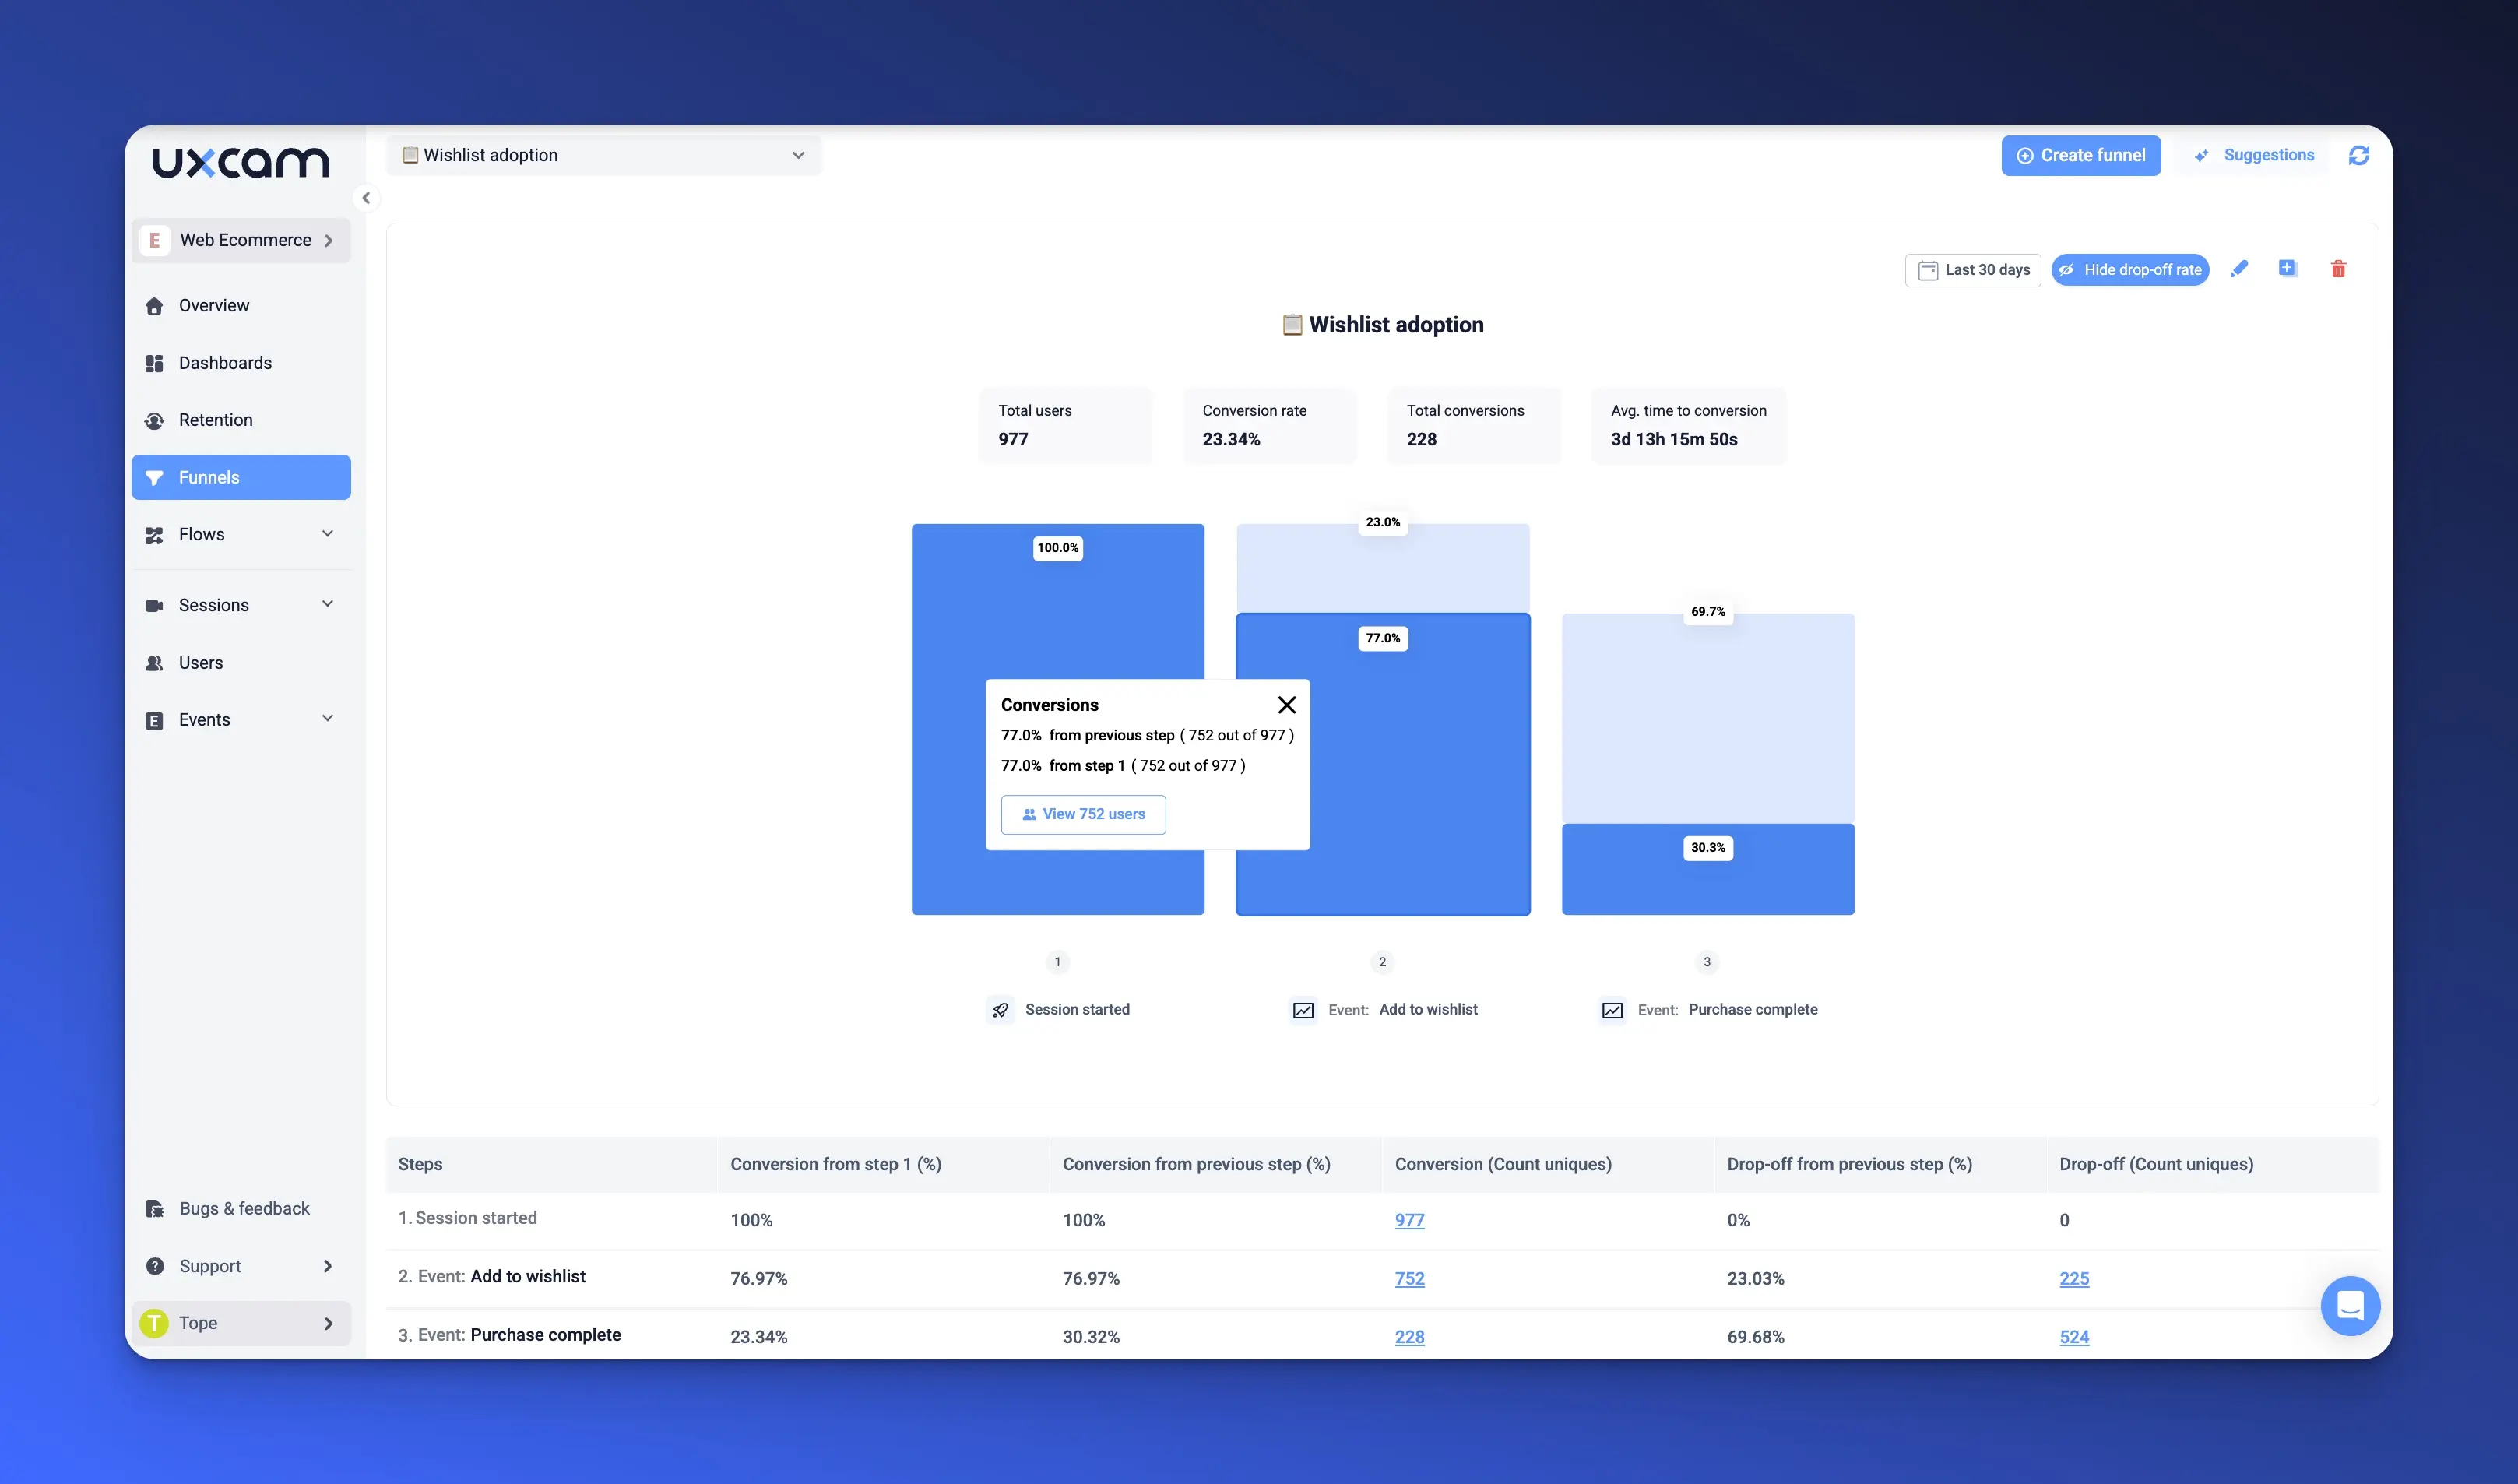
Need to understand your user journey from the first app open or website visit to conversion, or drop-off? UXCam makes that simple. You can create custom funnels in minutes, analyze where and why users abandon key flows and look at retention patterns based on user behavior, not just logins. This level of depth gives product teams, UX designers, and marketers a shared language to understand and improve the app experience.


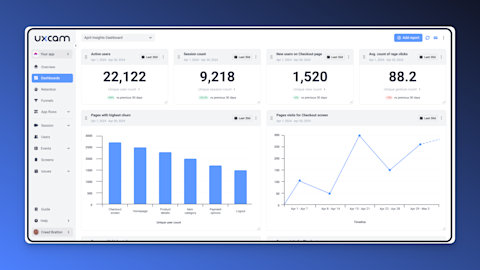
4. Intuitive dashboards for fast clarity
With UXCam, you don’t need to dig through complicated reports or switch between tools to understand your app’s performance. The dashboards are designed to be intuitive and immediately useful, helping you easily visualize key metrics like Daily Active Users (DAU), Weekly Active Users (WAU), and Monthly Active Users (MAU).
You’ll get a clear view of how user engagement trends over time, how new features are performing, and where users are dropping off—all in one place. This means faster decisions, quicker fixes, and more time spent on building a better product.


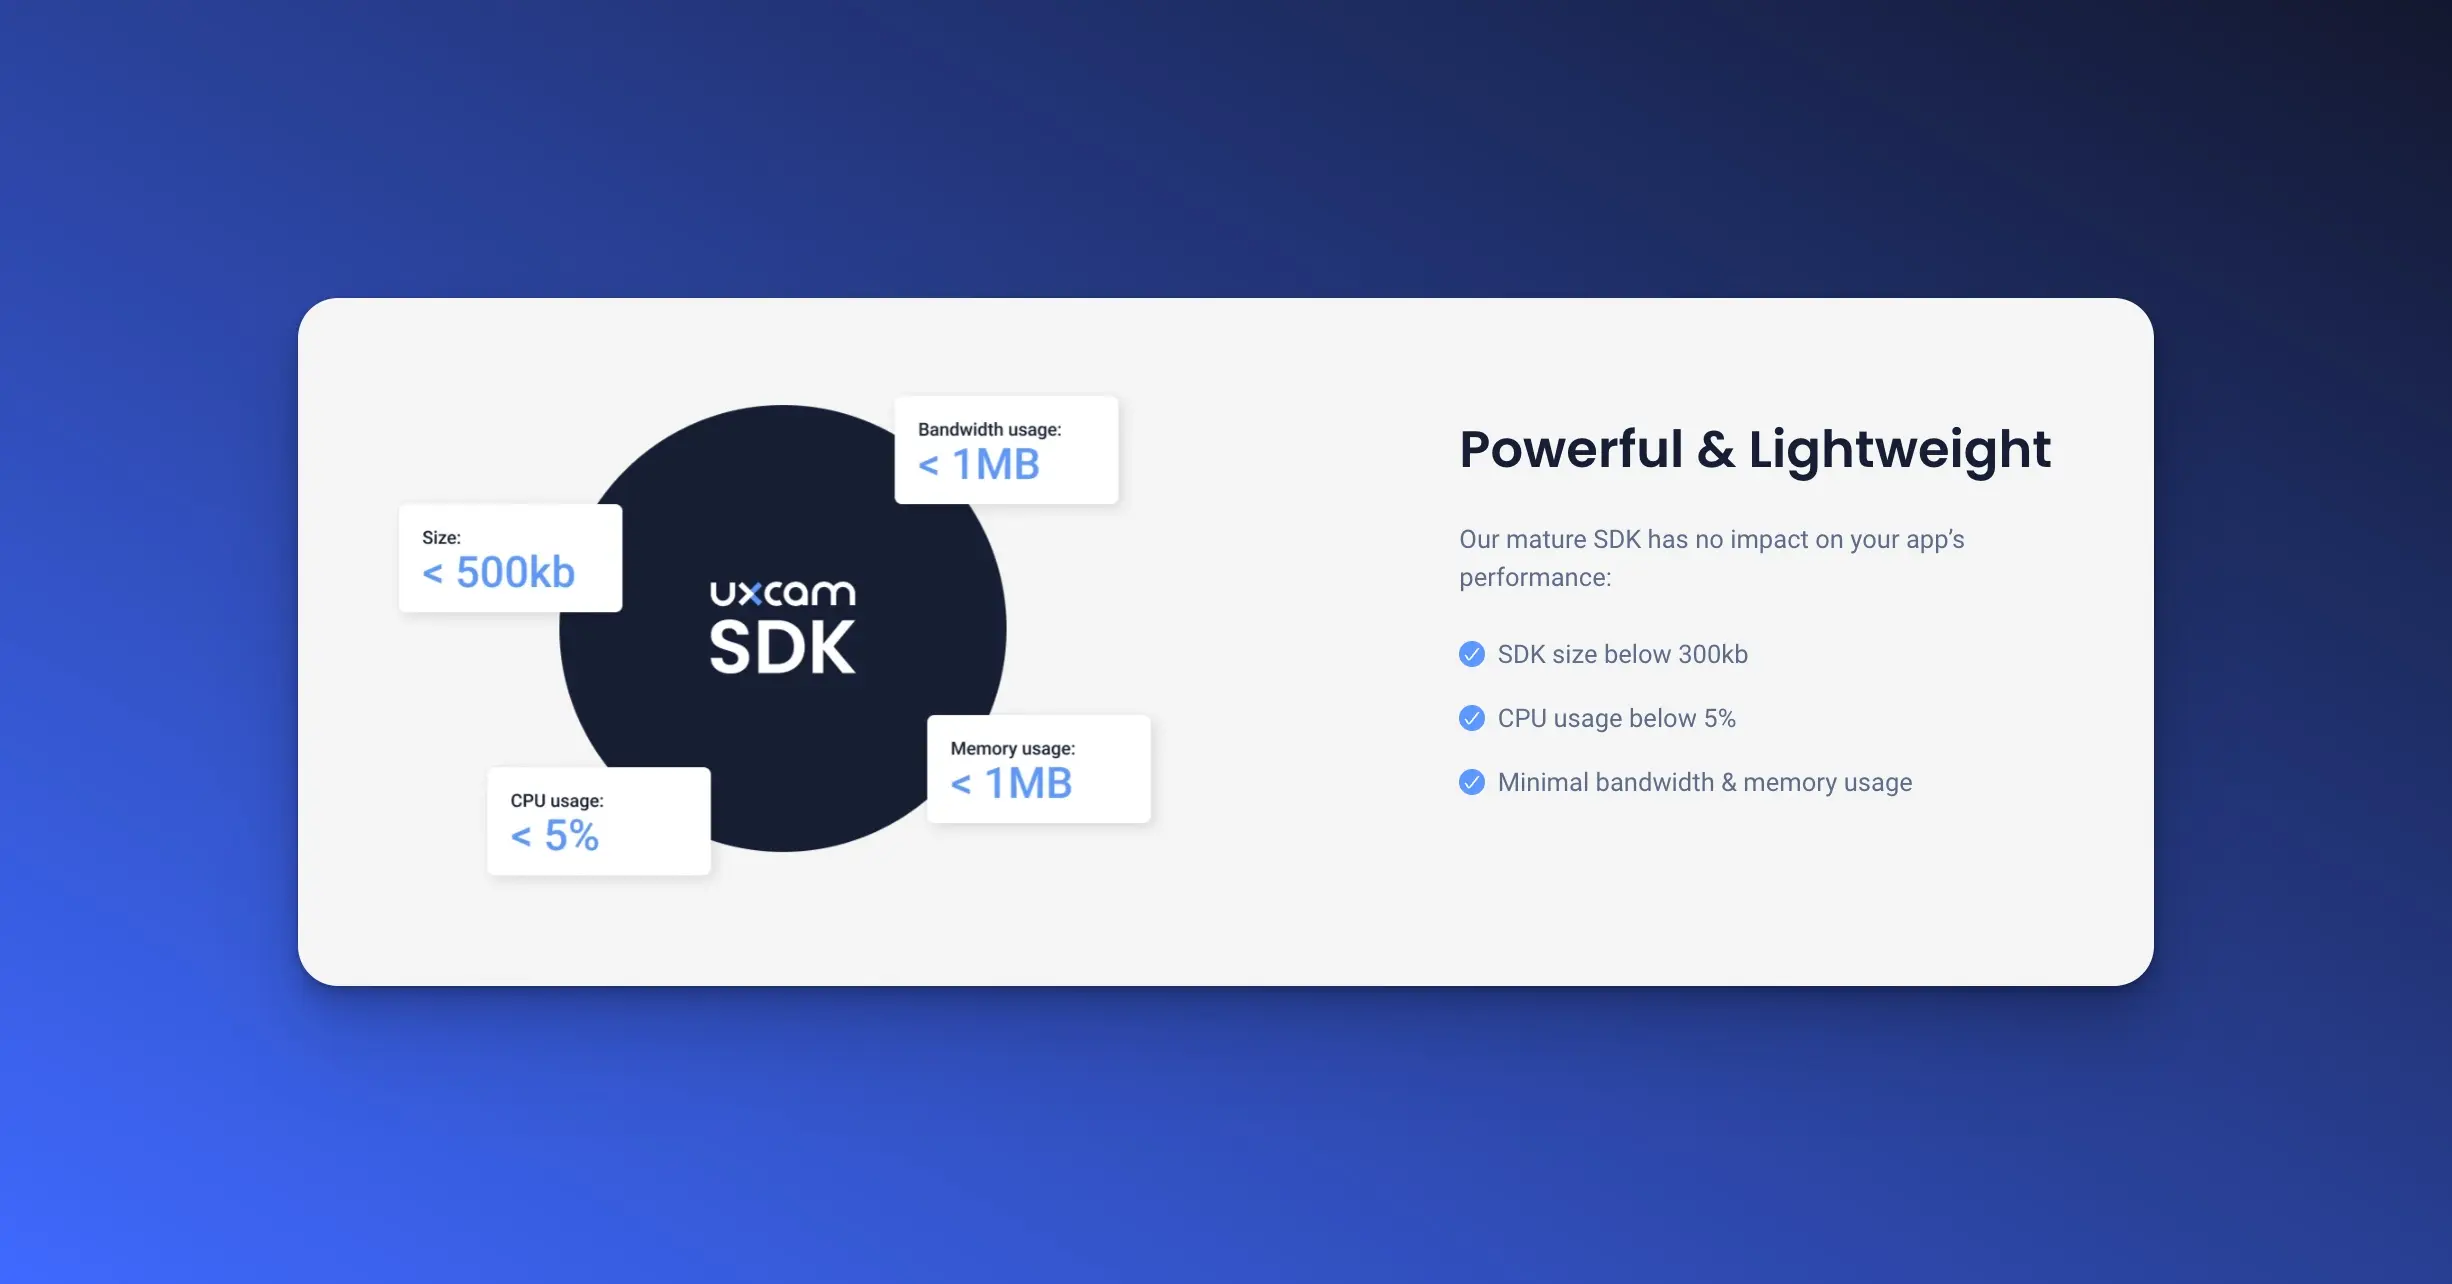
5. Built for speed, simplicity, and scale
UXCam’s lightweight SDK is designed to be set up in minutes, not weeks. Simply add the snippet to your app or website, and you’re ready to go. There’s no bulky setup, no waiting around for data to appear, and no bouncing between tools to figure out what happened. Whether you’re just getting started or scaling fast, UXCam moves at your speed. Also, there's no complicated transition between quantitative data (like user counts) and qualitative insights (like session recordings)—everything works together seamlessly, helping you quickly pinpoint improvements.
Step 3: Monitor active user trends
With your analytics up and running, the next step is turning that data into insight. Tracking active users isn't just about setting things up once and forgetting it—it’s about keeping a close, consistent eye on how user behavior evolves over time.
This is where monitoring comes in. When done right, it helps you spot problems early, measure the impact of changes, and stay ahead of user churn.
Let’s break it down.
Build Dashboards That Show You What Matters
To stay on top of user trends, you need dashboards that make sense at a glance. Start by setting up dashboards that highlight your core active user metrics—Daily Active Users (DAU), Weekly Active Users (WAU), and Monthly Active Users (MAU).


But don’t stop there. Add in:
Funnel reports to track how users move through key journeys like onboarding or checkout.
Retention curves to see how well you’re keeping users engaged over time.


These dashboards should become part of your weekly routine. Are DAU numbers dropping? Is retention improving? Are more users completing onboarding this month compared to last? A quick glance should give you answers.
Pro tip: If you’re using UXCam, the dashboards are already built to surface these insights intuitively, no extra configuration needed.
Audit your tracking regularly
Analytics is only useful if the data is accurate. That’s why it’s important to regularly audit your setup.
Here’s how to keep things in check:
Test your event tracking with your QA team or internal test users. Make sure everything that should be tracked, is being tracked.
Cross-check your metrics with what you're seeing in real usage. For example, if a feature is heavily promoted but showing low engagement, is the tracking implemented correctly?
Catching tracking issues early prevents bad data from leading you in the wrong direction.
Spot patterns early and act fast
Once you’ve got accurate data and real-time dashboards, start looking for patterns. Some trends will be gradual and expected. Others may jump out and require immediate attention.
Are your DAU or WAU numbers suddenly dipping?
Did a recent update lead to a spike in support tickets or drop-off at a specific screen?
This is where tools like UXCam really shine. With session replays, you can watch real user sessions to investigate exactly what’s going on. If users are getting stuck or frustrated, you’ll see it. No need to guess.
And if you’re seeing an unexpected drop in your funnel completion rate, you can use journey analysis to uncover friction points.
Step 4: Segment your users for deeper insights
Now that your tracking is up and running—and you’ve got accurate data flowing in—it’s time to get more specific. Not all active users behave the same way, and treating them as one big group can cause you to miss critical insights.
This is where UXCam’s segmentation solution come in. With just a few clicks, you can break your user base down into meaningful groups and understand how each one behaves.


Here’s how to get started:
Segment by behavior and lifecycle
UXCam lets you segment users based on in-app behavior, making it easy to compare how different groups engage.
New vs. returning users: See how new users interact with onboarding flows versus how returning users navigate core features. Are new users getting stuck? Are returning users skipping parts of the experience?
By journey stage: Filter users who dropped off mid-way through a funnel, completed an event, or didn’t interact with a key feature at all. You’ll quickly see which group needs the most attention.
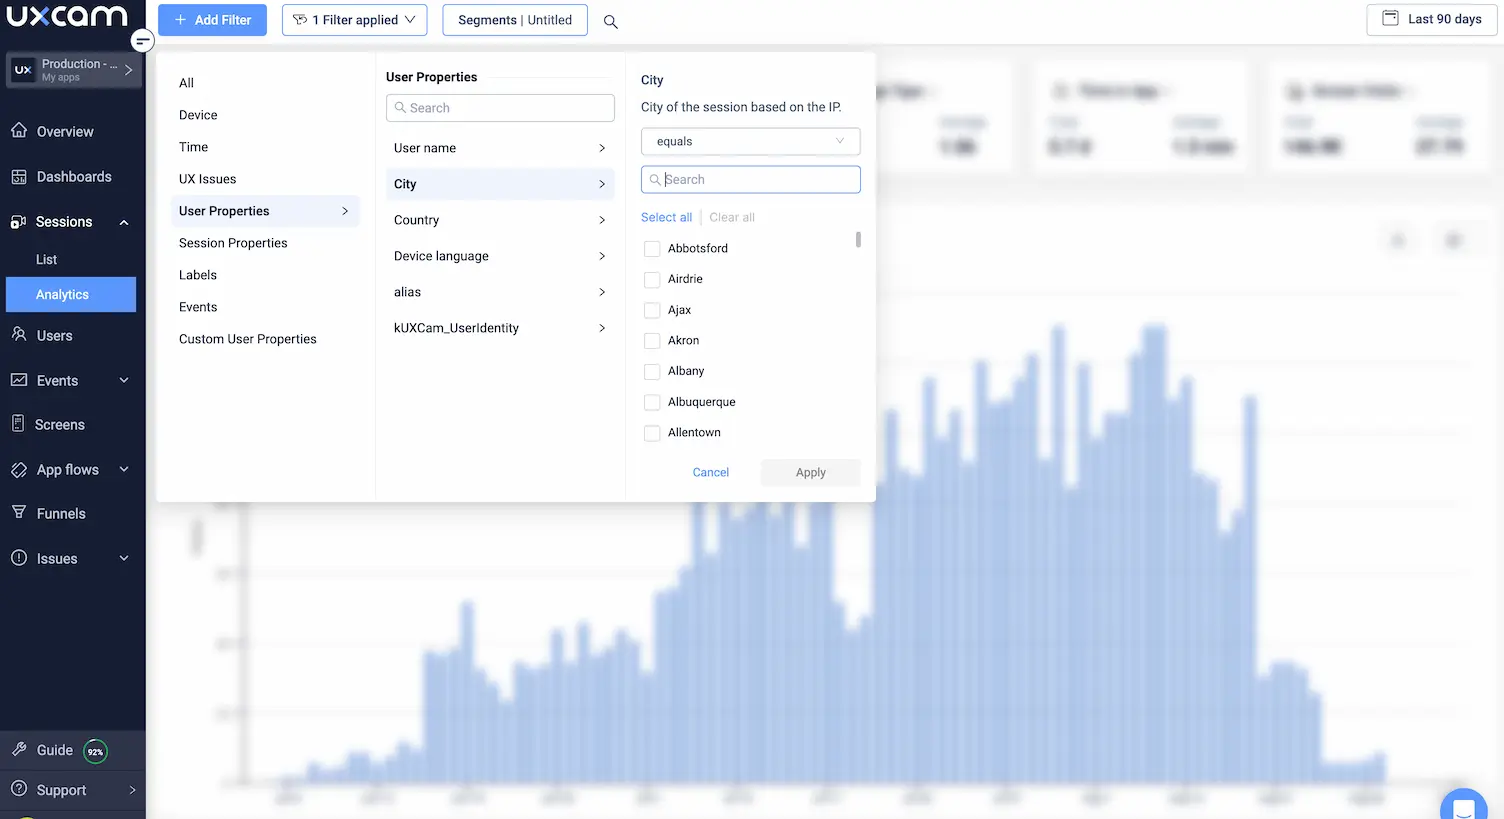
Segment by context
Context matters, and UXCam allows you to filter sessions based on device, location, app version, and more.
Geographic location: Are users in certain regions engaging more? Do others struggle with navigation or conversion? Use location filters to spot opportunities for localization or targeted improvements.
Device type and OS: UXCam helps you uncover platform-specific issues. Maybe Android users are dropping off at a certain screen that works perfectly on iOS. With this insight, you can prioritize fixes where they matter most.
With this level of segmentation, you’re no longer guessing who your most valuable users are—or who needs help. You're making decisions backed by real data and real behavior.
Step 5: Optimize based on actionable insights
Once you've identified patterns and gaps in engagement, it's time to put your findings into action. This is where UXCam moves from a passive analytics tool to an active growth driver.
Here’s how to use your insights to optimize your product experience.


Pinpoint and fix engagement gaps
With UXCam’s session replays, funnels, and heatmaps, you can immediately uncover where users lose interest, get confused, or drop off entirely.
Is onboarding too complex?
Are users abandoning checkout?
Are important features being ignored?
You’ll see what users saw, where they tapped, where they hesitated—and why they left. This removes the guesswork and speeds up your path to improvement.
Test and validate product changes
Don’t just roll out updates and hope they work. Use UXCam to validate your changes through targeted A/B testing and follow-up analysis.
Develop hypotheses: Maybe a simplified onboarding screen will boost completion rates.
Make the change, release it to a test group, and use UXCam to track how behavior changes.
Watch real sessions to confirm whether the new experience is smoother and more engaging.
With UXCam, you're not just testing, you’re proving which updates improve active user rates.
Refine continuously, not just occasionally
Every product improvement is a step forward—but the real value comes from continuous iteration. UXCam makes it easy to monitor the impact of every update.
Revisit funnels to track progress over time.
Use retention analytics to see if new users are sticking around longer.
Watch a few sessions every week to stay close to the real user experience.
This creates a feedback loop where your app gets better and your users stay more engaged, week after week.
Best practices for finding active users of an app
Here are a few best practices you can adopt when finding an app’s active users. .
Understand your “active user”
Identify the specific user actions and behaviors that define activity within your app. This could include frequent logins, completing tasks, or engaging with key features. By pinpointing these actions, you can accurately categorize and monitor genuinely engaged users.
Track active users properly
Tracking your app’s active users is key to making informed decisions about user engagement and retention. A few ways to ensure this include using the right tools, monitoring trends, and validating data regularly.
Act on the collected data
Regularly update features, fix problems, and improve the user experience based on what you learn from your user data. This will result in an improved app and happier users.
Conclusion: Know your active users today
With UXCam, you get more than just numbers. You see how users interact with your app in real time, uncover where they’re getting stuck, and make confident, data-driven decisions to improve engagement. From effortless setup to powerful tools like session replays, funnels, and heatmaps, UXCam helps you turn insight into impact—fast.
If you're ready to stop guessing and start optimizing your app with confidence, it’s time to see UXCam in action.
Try UXCam for free today and discover how easy it is to understand your users and grow your app’s success.
FAQ
You might also be interested on this;
How to grow active users (DAU, WAU, MAU) in your mobile app
How to Figure Out Why Your Apps Keep Crashing
Best Practices for Error Handling in React Applications
User adoption strategy - How to win & keep loyal app users
How to use mobile app funnel analytics to convert more users
AUTHOR
Tope Longe
Product Analytics Expert
Ardent technophile exploring the world of mobile app product management at UXCam.


Related articles


Product Management
12 Best Product Analytics Tools and Software 2026
Discover the top product analytics tools and learn how to extract valuable insights, optimize performance, and drive growth with these powerful...


Jonas Kurzweg
Product Analytics Expert


Curated List
7 Best AB Testing Tools for Mobile Apps
Learn with examples how qualitative tools like funnel analysis, heat maps, and session replays complement quantitative...


Jane Leung
Product Analytics Expert


Tool Comparisons
UXCam vs Amplitude: A real comparison for mobile product analytics
Compare UXCam and Amplitude for mobile product analytics. See where event-based metrics work, where they fall short, and how UXCam's AI-powered product analytics platform reveals what's actually happening in your...


Begüm Aykut
Growth Marketing Manager