The 15 Best Web Analytics Tools in 2026

This guide reviews the best web analytics tools for understanding how people use your website or web app. It covers how each tool works, what platforms they support, and how much they cost. You’ll also see which options are best for product teams, marketers, and businesses that care about privacy.
Quick Summary
Here's our pick of the 5 best web analytics tools:
UXCam - Best for web product analytics for deep behavior visibility
Google Analytics - Best for free web analytics for comprehensive traffic insight
Adobe Analytics - Best for enterprise web analytics for advanced segmentation
Hotjar - Best for qualitative web analytics for intuitive heatmaps
Matomo Analytics - Best for privacy-focused web analytics for full data ownership
Comparison Chart: Best Web Analytics Tools & Software
Here’s a quick comparison of the best tools;
| Tool | Best for | Supported platforms | Pricing (2025) |
|---|---|---|---|
| UXCam | Complete product and UX analytics for web and mobile | Web, iOS, Android | Free plan (3,000 sessions/month) + usage-based paid plans. |
| Google Analytics 4 | Free general web analytics | Web, mobile | Free base tier; premium (“Google Analytics 360”) for large enterprises. |
| Adobe Analytics | Enterprise web & marketing analytics | Web, mobile | Custom pricing |
| Mixpanel | Event-based product analytics | Web, iOS, Android | Free tier (1M events/month) + custom pricing |
| Hotjar | Visual behavior insights (heatmaps, session recording) | Web | Free tier + paid from ~$49/month |
| Matomo | Privacy-focused analytics (self-host or cloud) | Web | On-premise free; cloud from ~€22/month |
| Piano Analytics (formerly AT Internet Analytics Suite) | Enterprise compliant analytics | Web, mobile | Custom pricing |
| Amplitude | Product growth analytics | Web, iOS, Android | Free Starter plan; Plus from ~$61/month |
| Heap | Automatic event capture analytics | Web, iOS, Android | Free plan; custom pricing for paid plans |
| Tiny Analytics | Lightweight, privacy-first web analytics | Web | Free plan; paid starting at ~£49/month |
| SimilarWeb | Competitor benchmarking & traffic insights | Web, mobile | Free trial; paid from ~US$125/month or contact sales |
| Woopra | Customer journey analytics across channels | Web, mobile | Free tier; Pro plan starts at ~$49/month for 50K+ actions |
| Countly | Self-hosted/enterprise analytics platform | Web, mobile, desktop | Free Lite version; paid plan starts at $40/month |
| Snowplow | Custom behavioral data pipelines for large data teams | Web, apps | Custom pricing |
| Piwik PRO | Privacy-compliant analytics suite (hosting & consent) | Web, apps | Business plan from ~€35/month |
Now let’s look at each tool in detail.
1. UXCam


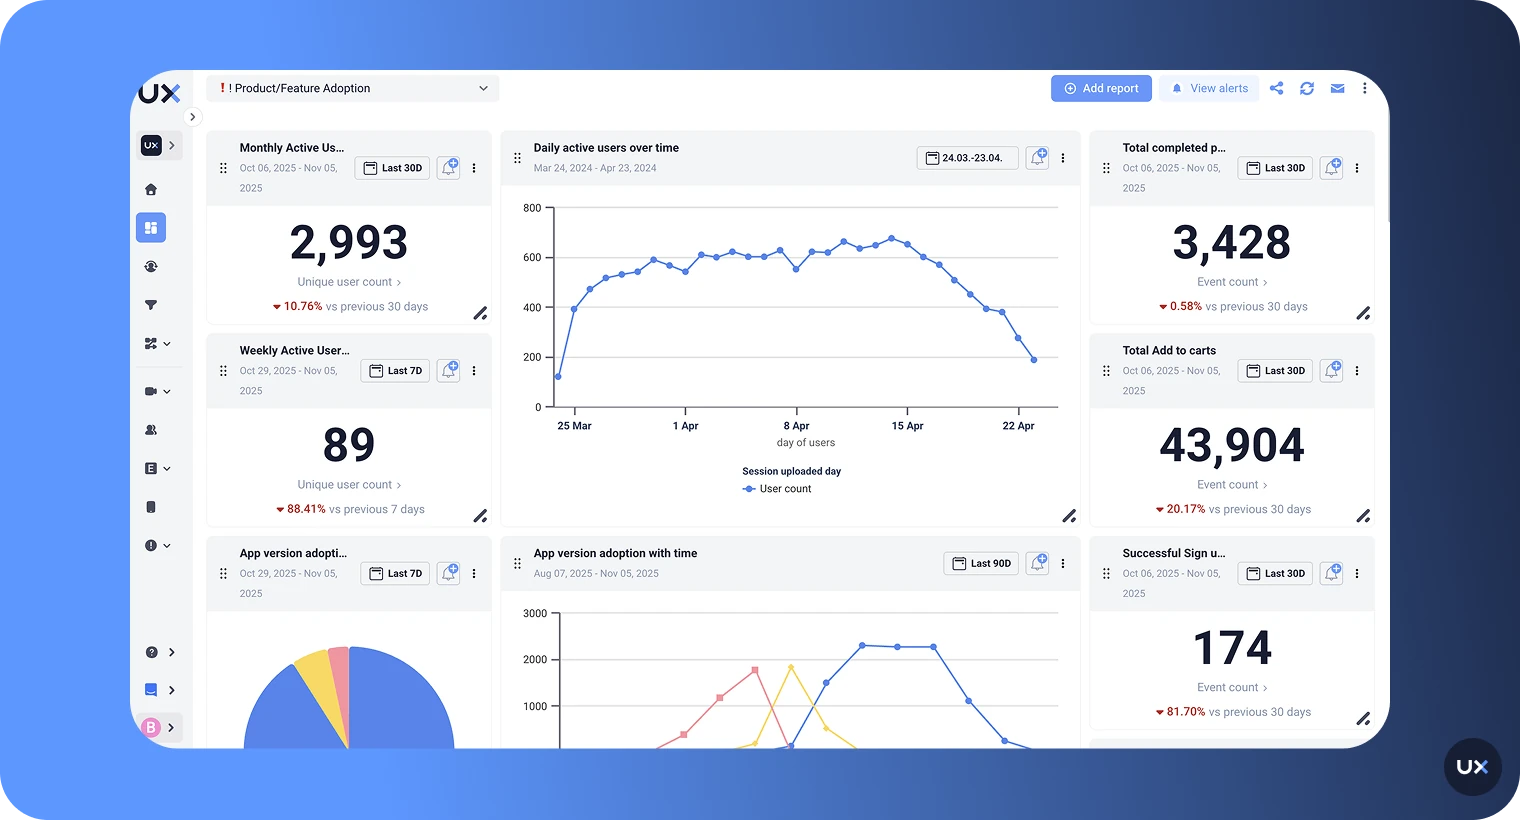
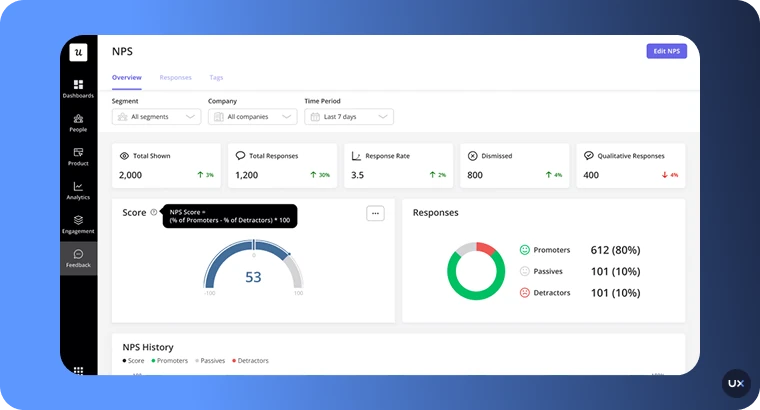
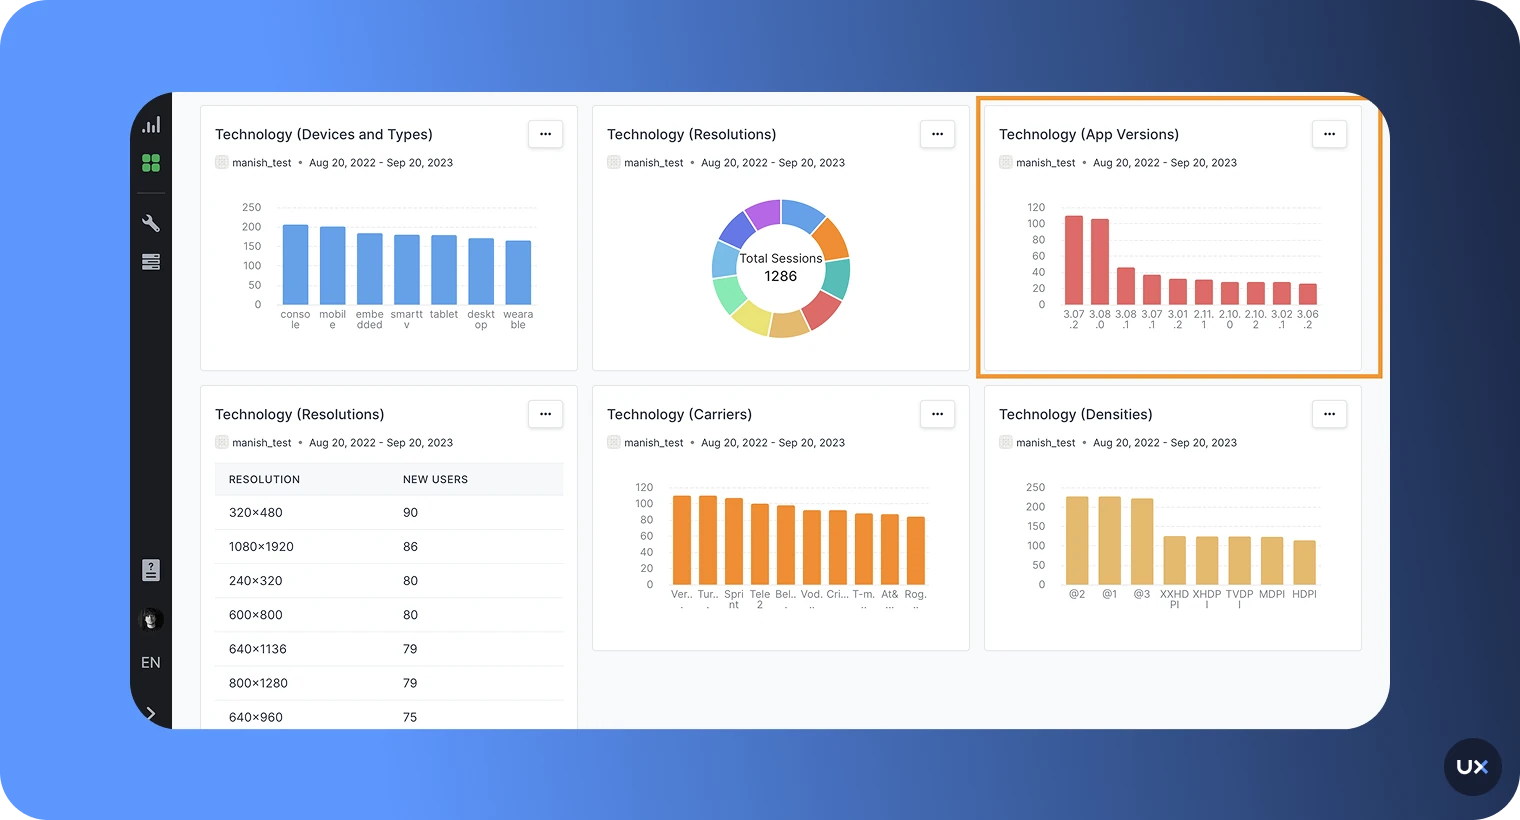
UXCam helps teams go beyond surface-level metrics to truly understand how users experience their product. It combines behavioral analytics with visual context, giving you the “why” behind every user action. From conversion analysis to UX diagnostics, UXCam brings everything you need for smarter product decisions into a single, easy-to-use platform.
Unlike tools that only track clicks and events, UXCam automatically records every screen, gesture, and technical event across mobile and web, no manual setup required. Product, UX, and engineering teams can instantly see where users struggle, why they drop off, and what drives retention.
Over 37,000 products use UXCam product analytics to analyze their users’ behavior and reveal how people truly experience their apps and websites.
| Features | Description |
|---|---|
| Unified Analytics | Combines web and mobile app product analytics into one platform, providing a seamless view of user behavior across devices. |
| Session Replay | Provides detailed session replays that visually present user interactions, frustrations, and drop-offs without requiring additional integrations. |
| Granular Segmentation | Allows in-depth filtering of data by device type, user behavior, session properties, and custom attributes for precise analysis. |
| Autocapture Technology | Automatically records user interactions without requiring manual event tagging, significantly reducing setup time. |
| Custom Dashboards | Supports the creation of dashboards tailored to specific needs, enabling teams to track KPIs and share insights efficiently. |
| Conversion Funnel Analysis | Tracks user behavior through funnels to identify drop-off points and refine the customer journey. |
| Behavioral Insights | Provides insights into navigation patterns, feature adoption, and engagement metrics to support data-driven decisions. |
| Cross-Team Collaboration | Offers a unified data source to ensure consistent metrics across departments and support coordinated decision-making. |
What you can do with UXCam’s filters and custom events
Track payment abandonment: Identify drop-off points during checkout flows across browsers and network conditions to address technical barriers.
Analyze feature usage: Understand how specific user segments interact with key features and navigate dashboard screens.
Monitor account activation: Map the journey from signup to account connection, identifying friction points for different business sizes.
Evaluate user engagement: Detect when and why customer segments experience declining usage of core features over time.
Resolve registration friction: Track progress through multi-step registration flows and pinpoint where enterprise users abandon the process.
Pros
Combines qualitative and quantitative analytics in one unified dashboard.
Effortless setup with autocapture, no manual tagging or complex configuration needed.
Minimizes developer workload while delivering complete behavioral visibility out of the box.
Easy for all teams to use with customizable dashboards and templates.
Enables seamless collaboration through shared reports and organization-wide insights.
Flexible analysis to track drop-offs, feature adoption, and user engagement trends.
Cons
Advanced configurations may require developer input
| Supported platforms | Pricing | Review Score (G2) |
|---|---|---|
| Web and mobile apps (iOS, Android) | Free plan (3,000 sessions/month) + usage-based paid plans. | 4.6/5 |
2. Google Analytics


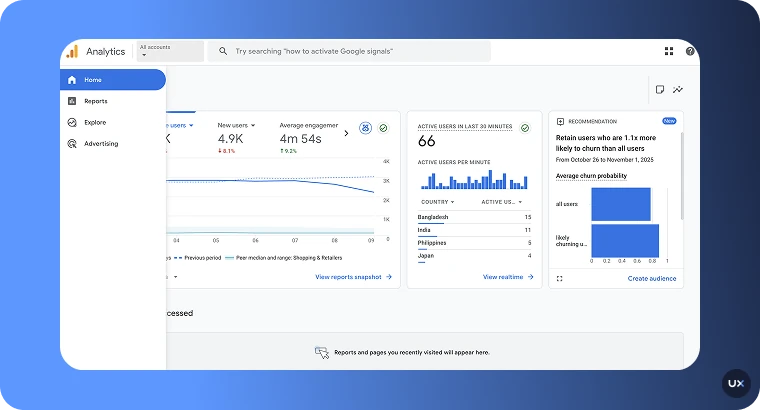
Google Analytics remains a cornerstone in the realm of web analytics tools. Its robust features, such as real-time data tracking, audience segmentation, and comprehensive reporting capabilities, make it indispensable for businesses of all sizes. The integration with other Google services, like Google Ads and Search Console, enhances its utility, providing a holistic view of your online presence.
Key features
| Features | Description |
|---|---|
| Data Analysis | Analyze user behavior, understanding traffic sources, sessions, and interactions. |
| Reporting Diversity | Generate various reports, including audience demographics, behavior flow, and e-commerce tracking. |
| Integrations | Seamlessly integrate with other tools like Google Ads, Search Console, and third-party applications. |
| Machine Learning Insights | Use AI to uncover trends, predict outcomes, and automate decision-making processes. |
| Conversion Measurement | Track and analyze conversions to understand the effectiveness of marketing campaigns. |
Pros
Comprehensive insights on website performance.
Integration with various marketing tools and platforms.
Advanced features like machine learning-driven insights for enterprises.
Scalable solutions catering to both small businesses and large enterprises.
Cons
Premium features can be expensive for small businesses.
Potential data privacy concerns with third-party data sharing.
Customization options can be overwhelming without proper training.
Pricing
| Supported platforms | Pricing | Review Score (G2) |
|---|---|---|
| Web, mobile | Free base tier; premium (“Google Analytics 360”) for large enterprises. | 4.5/5 |
3. Adobe Analytics


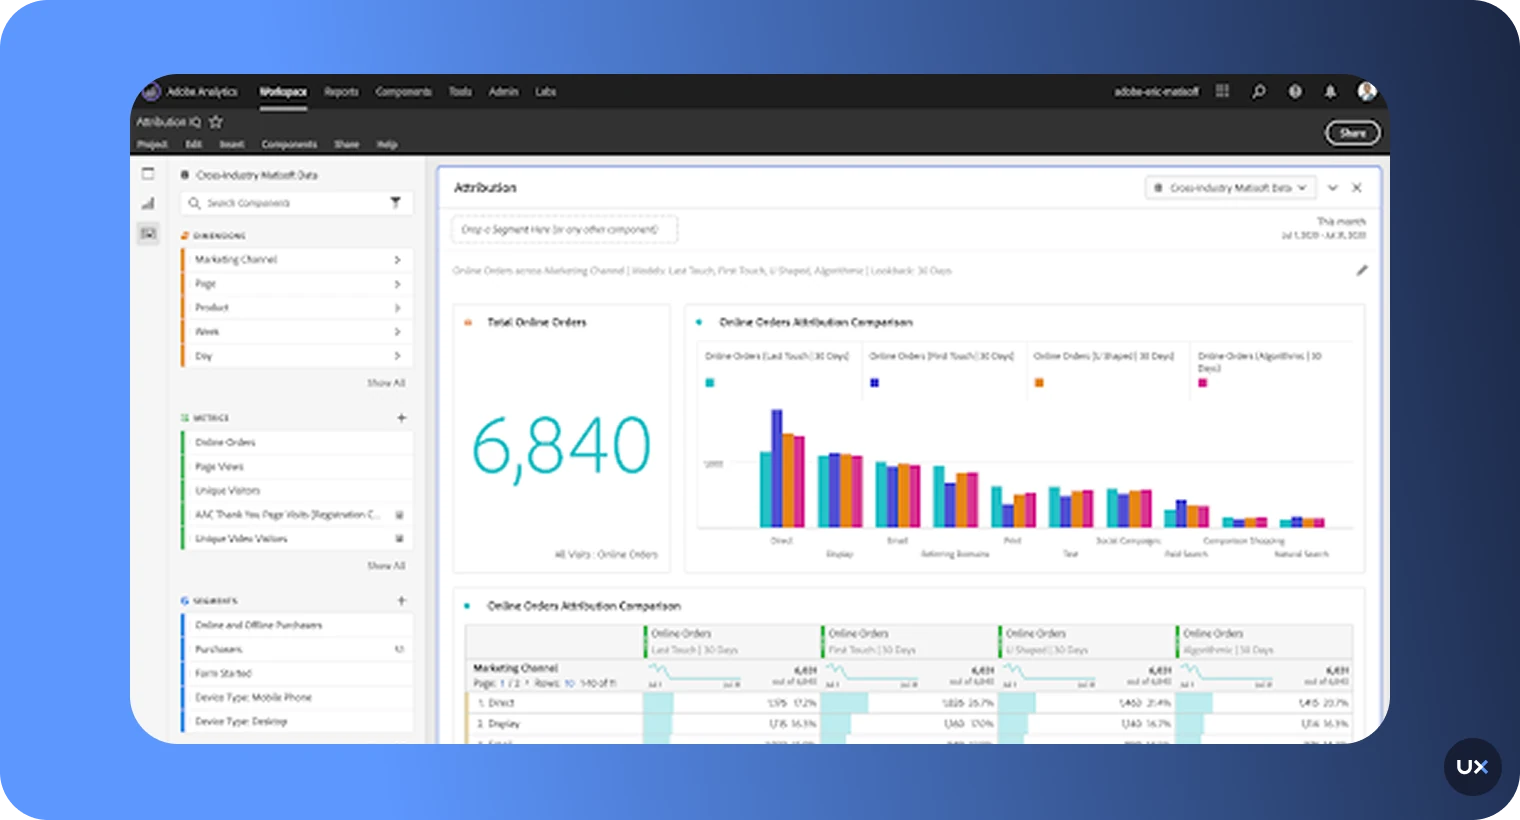
Adobe Analytics is another popular web analytics tool. Known for its advanced data analysis and visualization capabilities, Adobe Analytics excels in providing deep insights into customer behavior. Its ability to integrate with other Adobe Experience Cloud products allows for a seamless and enriched user experience, making it a preferred choice for large enterprises.
Key features
| Features | Description |
|---|---|
| Real-Time Reporting | Track and analyze website and campaign performances instantaneously with up-to-date data. |
| Data Integration | Seamlessly integrates with other Adobe Cloud services to provide a comprehensive solution for data analysis. |
| Advanced Segmentation | Divide your audience into highly specific segments to understand their behaviors and preferences better. |
| Customizable Dashboards | Create tailored dashboards to visualize critical metrics according to your specific needs. |
| Cross-Channel Analytics | Analyze data from multiple marketing channels in one central platform for a holistic view. |
Pros
Robust data analysis with Adobe Cloud
Comprehensive tracking of campaign details
High level of customization
Optimizes and improves website performance
Cons
Steeper learning curve
Higher price tag compared to other tools
No built-in visual behavior analytics, making qualitative insights harder to analyze.
Pricing
| Supported platforms | Pricing | Review Score (G2) |
|---|---|---|
| Web, mobile | Custom pricing | 4.1/5 |
4. Mixpanel


Mixpanel focuses on product analytics, offering detailed insights into user interactions with web and mobile applications. Its event-based tracking system allows businesses to understand user behavior at a granular level, making it ideal for product managers and developers who aim to optimize user engagement and retention.
Key features
| Feature | Description |
|---|---|
| In-Depth User Behavior Analysis | Provides detailed insights into user interactions, helping understand how users engage with your product. |
| Event Tracking | Allows you to monitor specific user actions and events, such as clicks, form submissions, and feature usage. |
| Segmentation | Lets you divide your user base into segments based on behavior patterns, demographics, or other criteria. |
| Funnels Analysis | Helps identify where users drop off in the conversion process, enabling you to optimize your funnel for better results. |
| Cohort Analysis | Analyzes groups of users over time to understand their behavior and retention rates. |
Pros
Real-time data tracking for immediate insights.
Event-based analytics for detailed behavioral analysis.
Advanced segmentation options to target specific user groups.
User-friendly interface with customizable dashboards.
Cons
Can be costlier compared to other basic analytics tools.
May require technical setup for full functionality.
Occasional delays in data processing for complex queries.
Pricing
| Supported platforms | Pricing | Review Score (G2) |
|---|---|---|
| Web, iOS, Android | Free tier (1M events/month) + custom pricing | 4.6/5 |
5. Hotjar


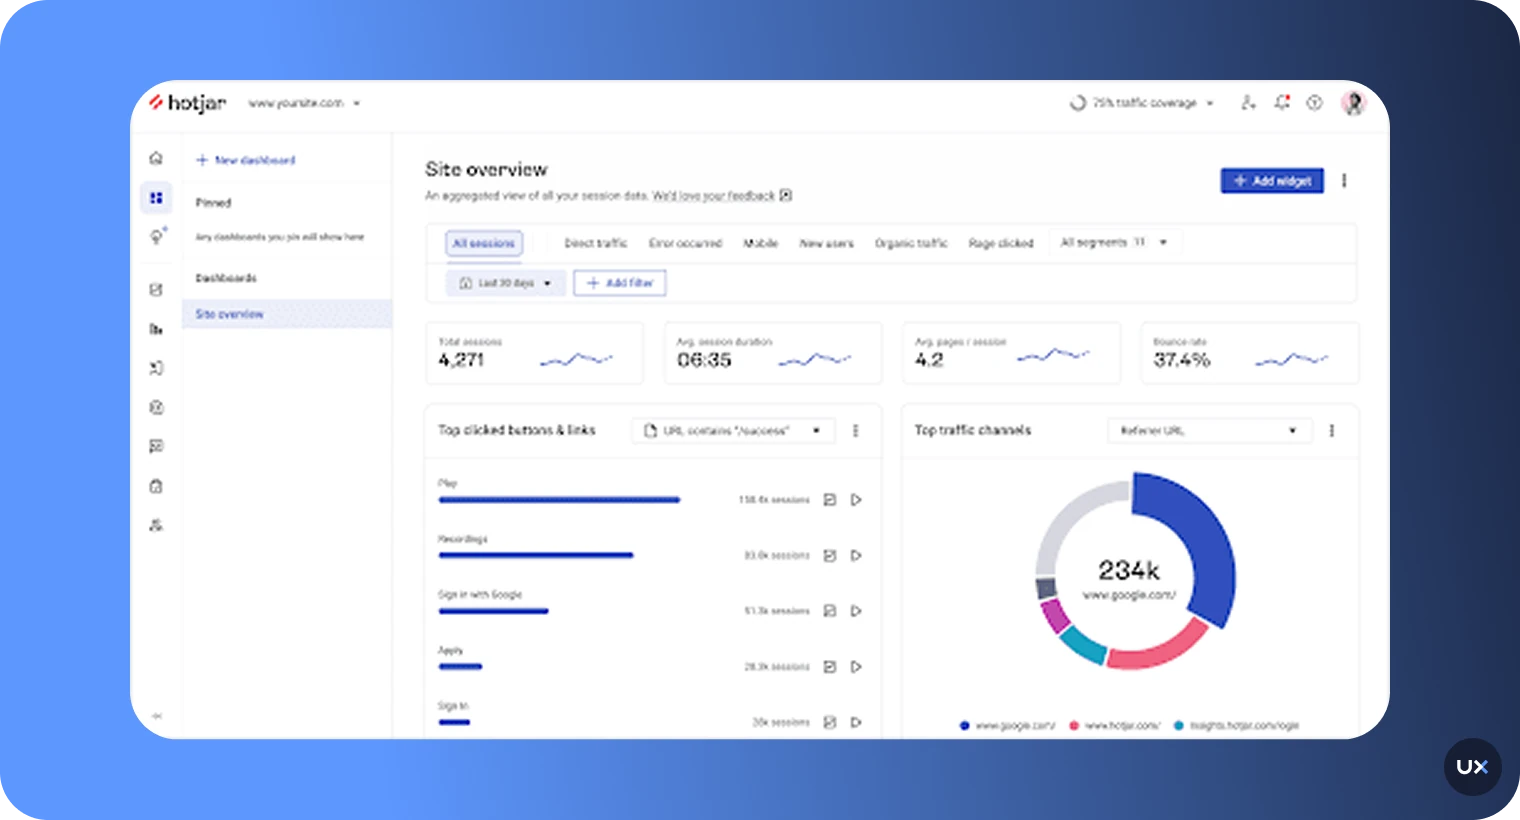
Hotjar combines traditional web analytics with user feedback tools, such as heatmaps, session recordings, and surveys. This combination allows businesses to not only track user behavior but also understand the 'why' behind it. Hotjar is particularly useful for UX designers and marketers looking to improve user experience and conversion rates.
Key features
| Feature | Description |
|---|---|
| Heatmaps | Visualize where users move, click, and scroll on a webpage, helping identify areas of friction and opportunities for improvement. |
| Session Recordings | Record user sessions to see how users navigate a website, providing insights into user behavior and identifying usability issues. |
| Surveys | Collect in-the-moment user feedback through customizable surveys to understand user needs and preferences. |
| Feedback | Gather user feedback directly from the website to understand user satisfaction and areas for improvement. |
| Funnels | Analyze the steps users take to complete a task on your website, helping identify where users drop off and optimize conversion paths. |
Pros
Detailed insights on visitor behaviors, including clicks and scrolls.
Comprehensive heatmaps to visualize user interactions.
Supports multi-device analysis for a holistic view.
Real-time data reporting enhances timely decision-making.
Cons
The heatmap feature can be improved for better precision.
Complexity in navigating and interpreting monitoring history data.
Feature limitations in comparison to full-scale analytics or product tools.
Pricing
| Supported platforms | Pricing | Review Score (G2) |
|---|---|---|
| Web | Free tier + paid from ~$49/month | 4.3/5 |
6. Matomo Analytics


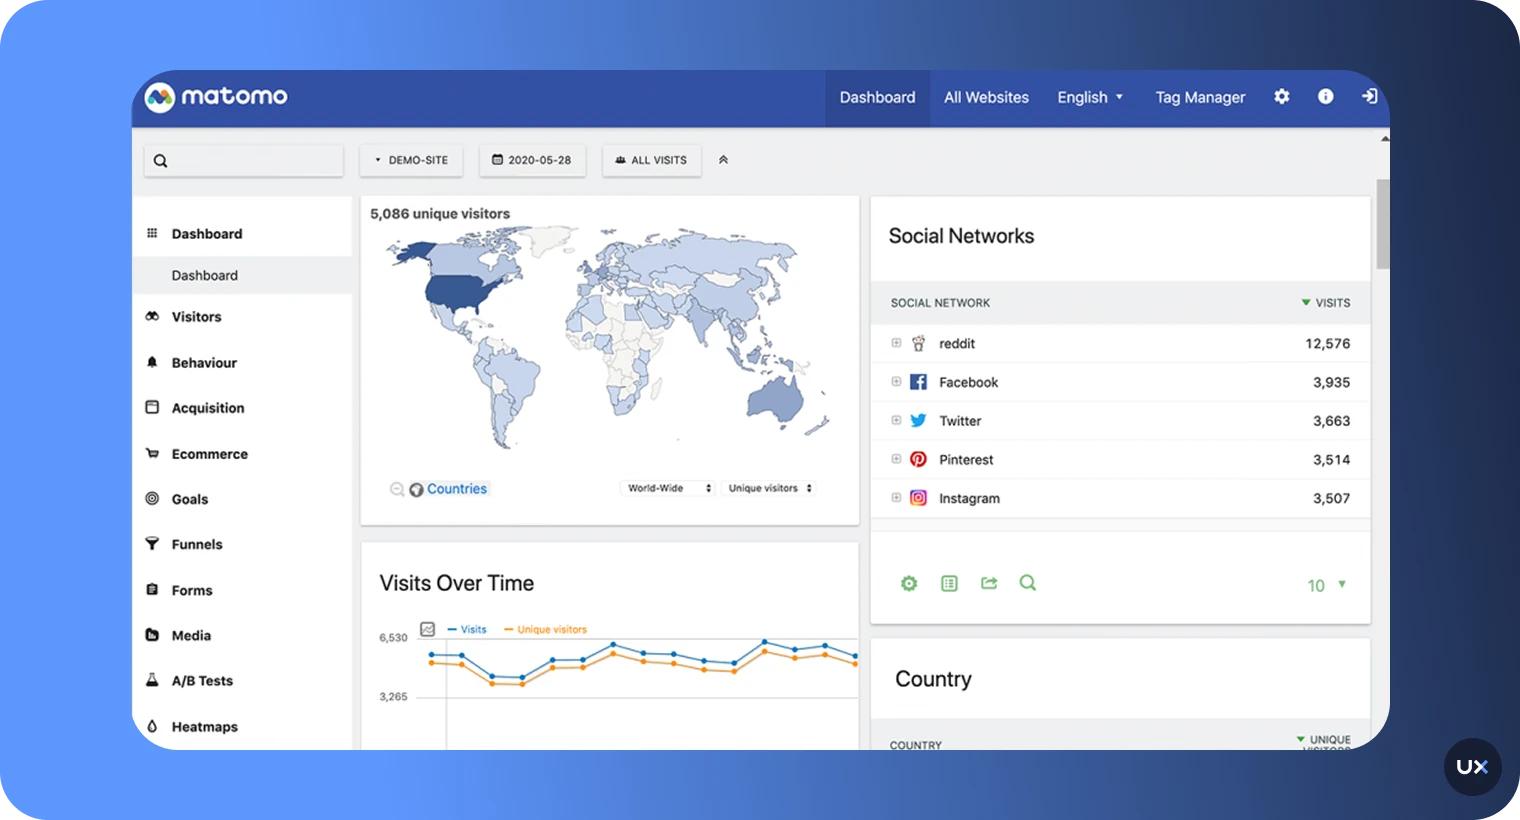
Matomo is an open-source web analytics platform that emphasizes data ownership and privacy. Unlike many other digital analytics tools, Matomo allows businesses to host their data on their own servers, ensuring complete control over their information. Its comprehensive feature set includes visitor profiles, goal tracking, and e-commerce analytics, making it a versatile option for privacy-conscious organizations.
Key features
| Feature | Description |
|---|---|
| Ecommerce Analytics | Provides advanced analytics features to understand and improve online business. |
| Event Tracking | Measures user interactions on websites and apps. |
| Content Tracking | Measures impressions, clicks, and click-through rates for various elements on pages. |
| User Privacy | Offers privacy-compliant analytics with GDPR tools, IP anonymization, and cookie-less options. |
| Graphs and Visualizations | Provides various data visualizations including Evolution Graphs, Tables, Sparkline Summary Cards, and Maps. |
Pros
Comprehensive data control and ownership, ensuring full compliance with GDPR and other data privacy regulations.
Rich feature set with in-depth analytics, user behavior analysis, and goal tracking.
Open-source nature, which allows for extensive customization and integration with other tools.
Transparent and ethical approach to data collection and processing.
Cons
Requires more technical expertise for setup and ongoing maintenance
Support options may vary, with premium support generally available only with purchased plans.
Some advanced features and functionalities are locked behind paywalls
Pricing
| Supported platforms | Pricing | Review Score (G2) |
|---|---|---|
| Web | On-premise free; cloud from ~€22/month | 4.2/5 |
7. Piano Analytics


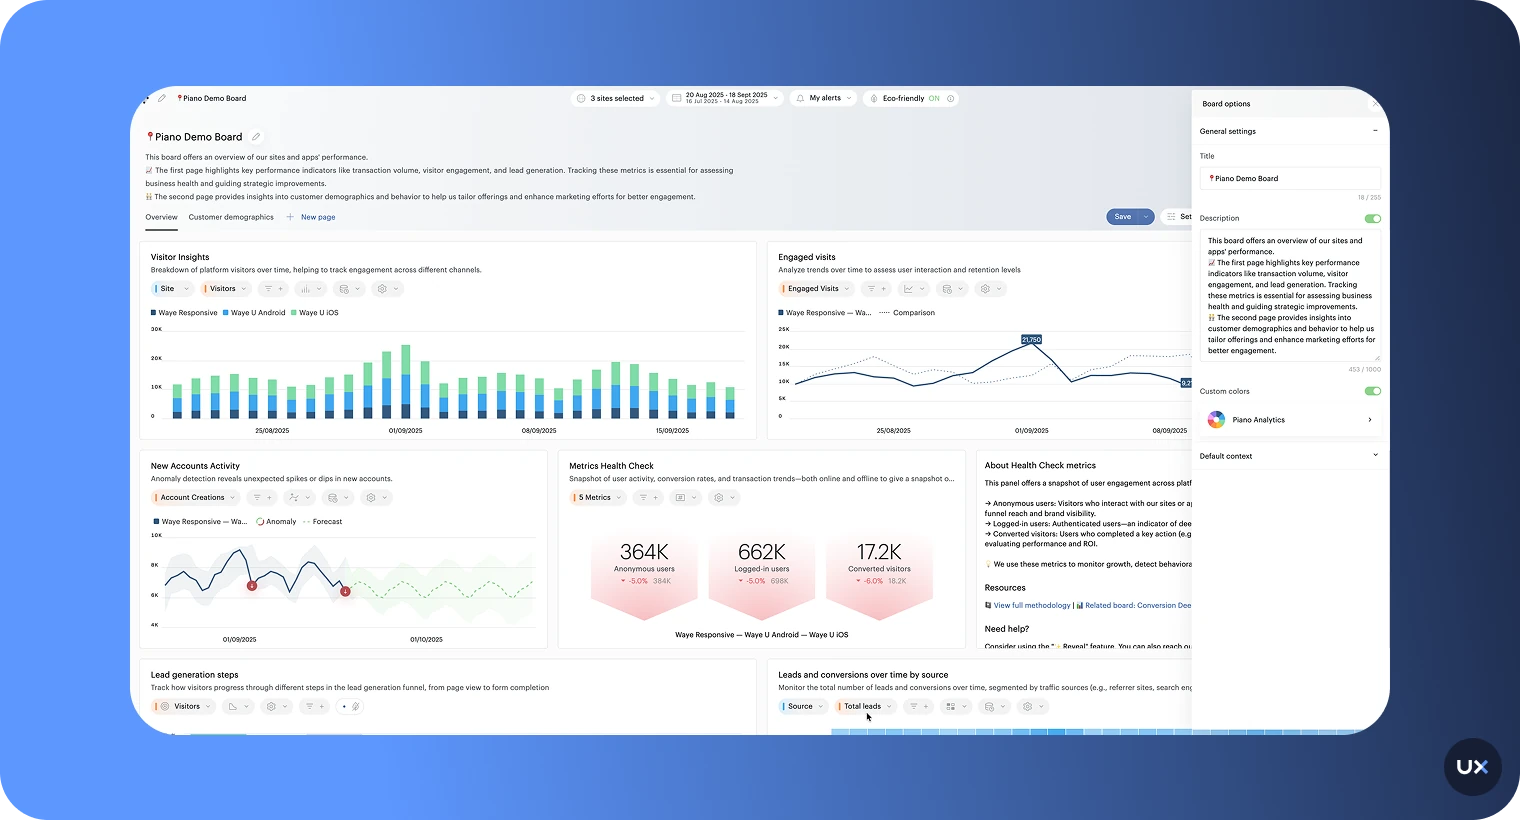
Piano Analytics (formerly AT Internet Analytics Suite) is an enterprise-grade digital analytics platform designed for organizations that need precise, privacy-compliant, and highly customizable data measurement. It combines powerful data collection, advanced segmentation, and real-time reporting within Piano’s wider digital experience ecosystem. The platform is built for large companies that require strict GDPR compliance, high data accuracy, and deep cross-channel insights.
Key features
| Feature | Description |
|---|---|
| Event & Behavioral Data Collection | Fully customizable event tracking with no sampling, bot filtering, and a unified data model. |
| Workspaces (Dashboards) | Drag-and-drop dashboards for reporting, visualization, and collaboration. |
| Data Query | Advanced query engine for building custom analyses and extracting granular datasets. |
| Real-Time Processing | High-scale event ingestion with low latency, suitable for high-traffic enterprise environments. |
| Privacy & Compliance | GDPR-compliant by design with data residency options and strong privacy controls. |
| Integrations & BI Connectivity | Direct export to data warehouses (e.g., Snowflake), APIs, and connections to BI tools. |
Pros
Exceptionally scalable and capable for large datasets and high-traffic environments.
Advanced query capability and rich visual dashboards for power users.
Strong privacy & compliance features make it suitable for regulated industries.
Seamless integration with data warehouses and BI tools.
Cons
High cost and enterprise pricing make it less accessible for smaller organizations.
Complex implementation that requires developer/analyst resources and setup time.
Some features may be more than necessary for non-publisher or smaller businesses.
For smaller teams, the licensing and professional services overhead may be burdensome.
Pricing
| Supported platforms | Pricing | Review Score (G2) |
|---|---|---|
| Web, mobile | Custom pricing | 4.4/5 |
8. Amplitude


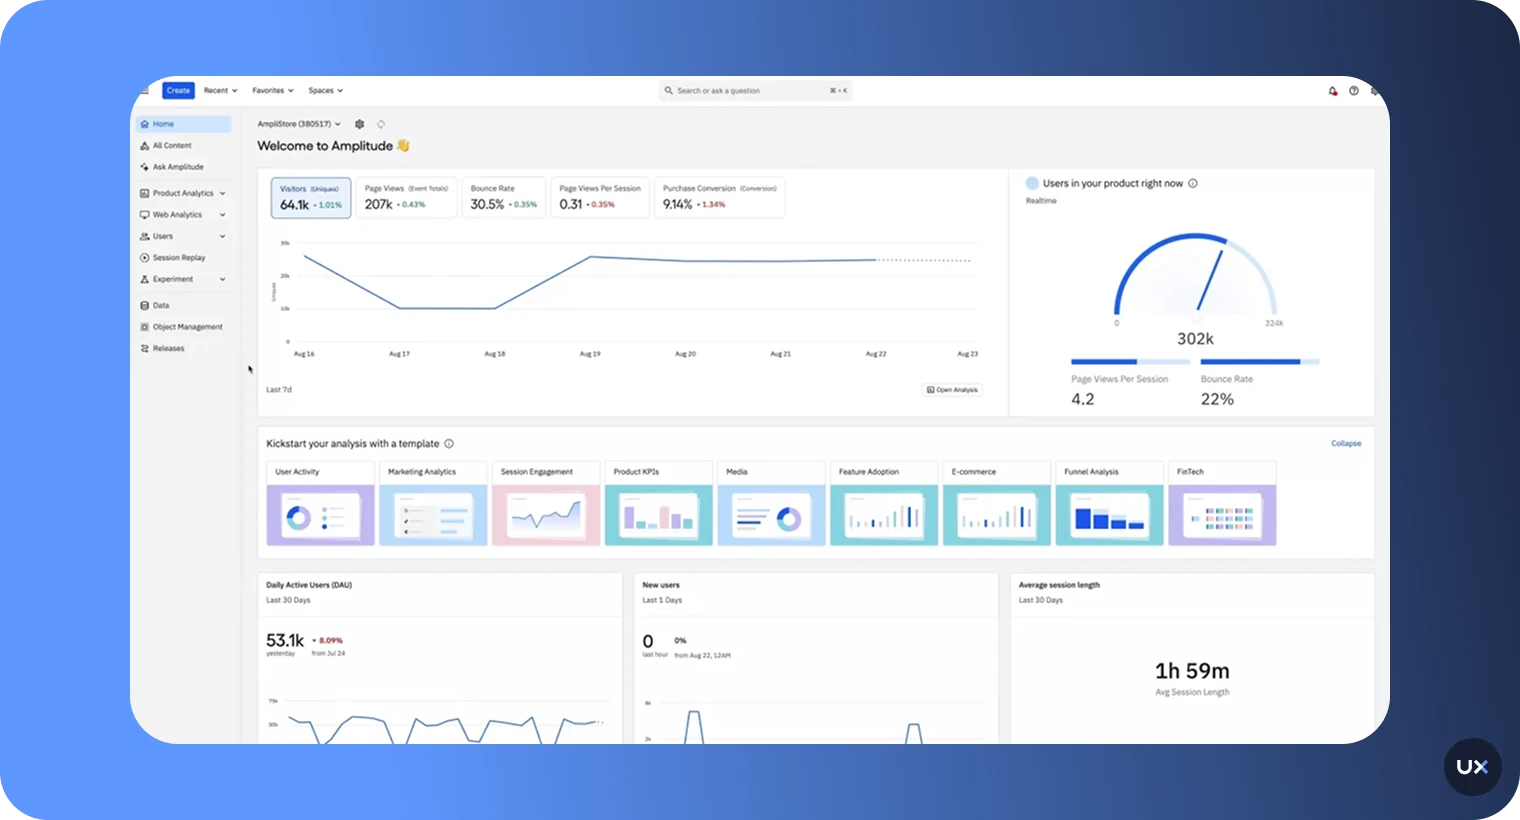
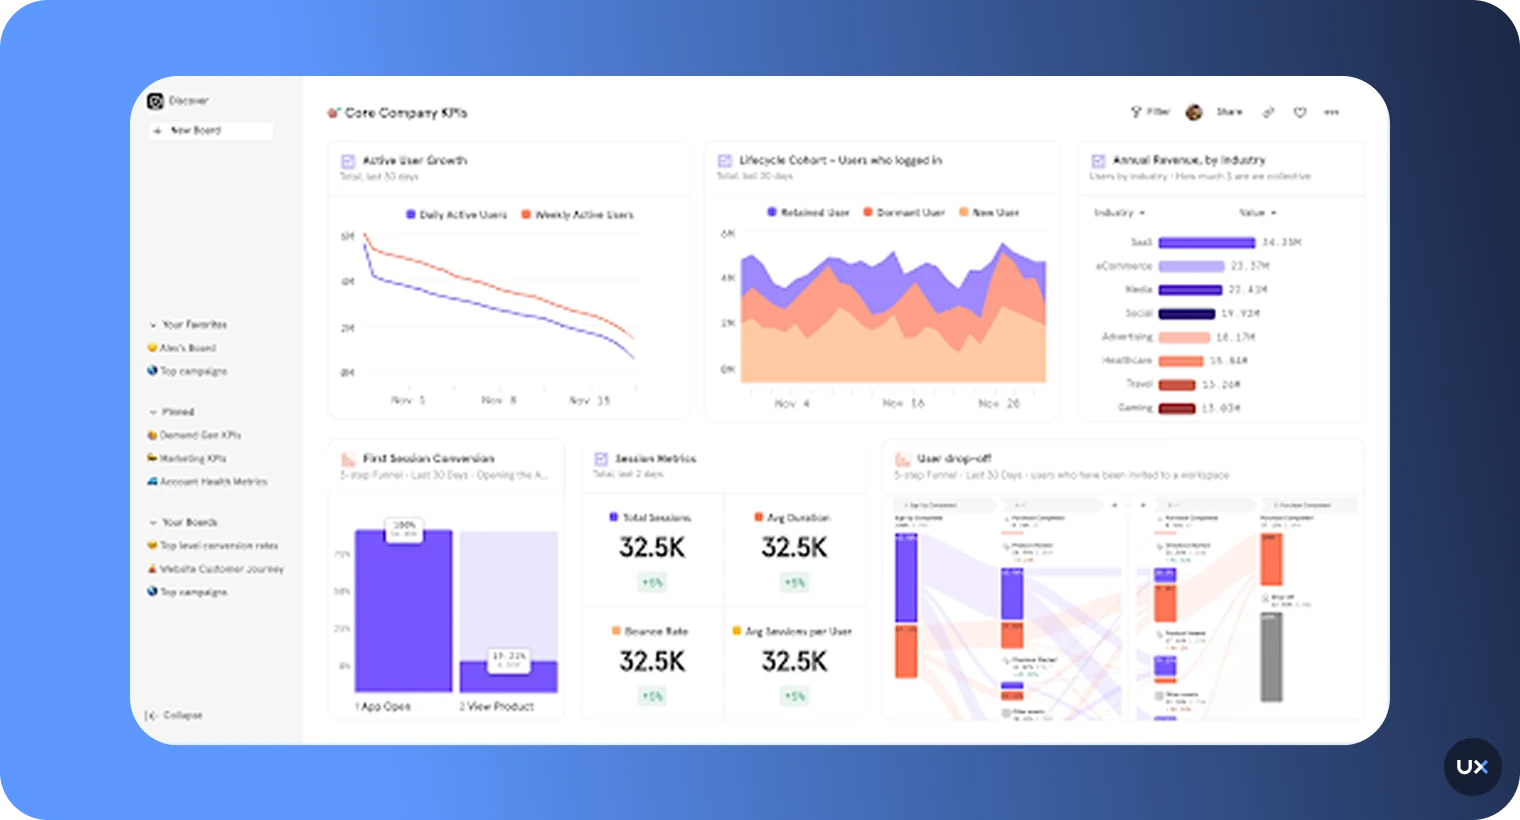
Amplitude is designed for real-time product analytics and event tracking. It excels in helping businesses understand user behavior to optimize the user experience. One of its key features is the ability to create custom behavioral cohorts, allowing you to group users based on specific actions or events. This makes it easier to target different user segments with personalized experiences and marketing campaigns.
Key features
| Feature | Description |
|---|---|
| Visitor Reports | Detailed insights into the number of visitors, their geographic locations, and referral sources. |
| Behavior Analysis | Tracks user interactions on your site, including page views, session duration, and click patterns. |
| Technical Information | Provides data on the devices, browsers, and operating systems used by visitors. |
| Marketing Campaigns | Monitors the effectiveness of your marketing campaigns and helps attribute conversions to specific efforts. |
| SEO Insights | Analyzes your site’s search engine performance, including keywords and traffic sources. |
Pros
Flexible segmentation and customization options.
Seamless integration with various data sources and platforms.
Strong focus on user behavior analysis and cohort tracking.
Actionable insights for product and marketing strategy.
Cons
Can become expensive for larger teams or enterprise use.
Some advanced features may require technical expertise.
Initial setup and configuration can be time-consuming.
Pricing
| Supported platforms | Pricing | Review Score (G2) |
|---|---|---|
| Web, iOS, Android | Free Starter plan; Plus from ~$61/month | 4.5/5 |
9. Heap


Heap simplifies the collection and analysis of behavioral data. It automatically captures every user interaction on your site, eliminating the need for manual tagging. With every interaction captured, Heap allows you to retroactively analyze data, meaning you won’t miss any crucial insights even if you forgot to set up a tag. This makes it a perfect tool for agile teams who need flexibility and real-time insights. You can dive deep into user journeys, segment audiences, and uncover behavioral patterns with ease.
Key features
| Feature | Description |
|---|---|
| Event Tracking | Automatically captures both no-code and server-side events, allowing users to track interactions in real-time across all touchpoints. |
| Session Replays | Visualizes the exact journey a user takes within a product, helping identify points of friction and optimize user experience. |
| Funnels and Paths | Analyzes user journeys and conversion rates, helping to identify drop-off points and optimize the sales funnel. |
| User Segmentation | Segments users based on various attributes such as demographics, behaviors, and product usage, allowing for targeted analysis and messaging. |
| Retroactive Analysis | Access and analyze historical user data, even for untracked events. |
Pros
Automatic data capture without the need for manual event tracking.
Real-time reporting for instantaneous insights.
Powerful segmentation and filtering capabilities.
Effective event visualizer to map out user journeys.
Cons
Limited customization options for advanced users.
Higher pricing tiers can be expensive for smaller businesses.
Occasional lag in real-time data updates.
Pricing
| Supported platforms | Pricing | Review Score (G2) |
|---|---|---|
| Web, iOS, Android | Free plan; custom pricing for paid plans | 4.4/5 |
10. Tiny Analytics


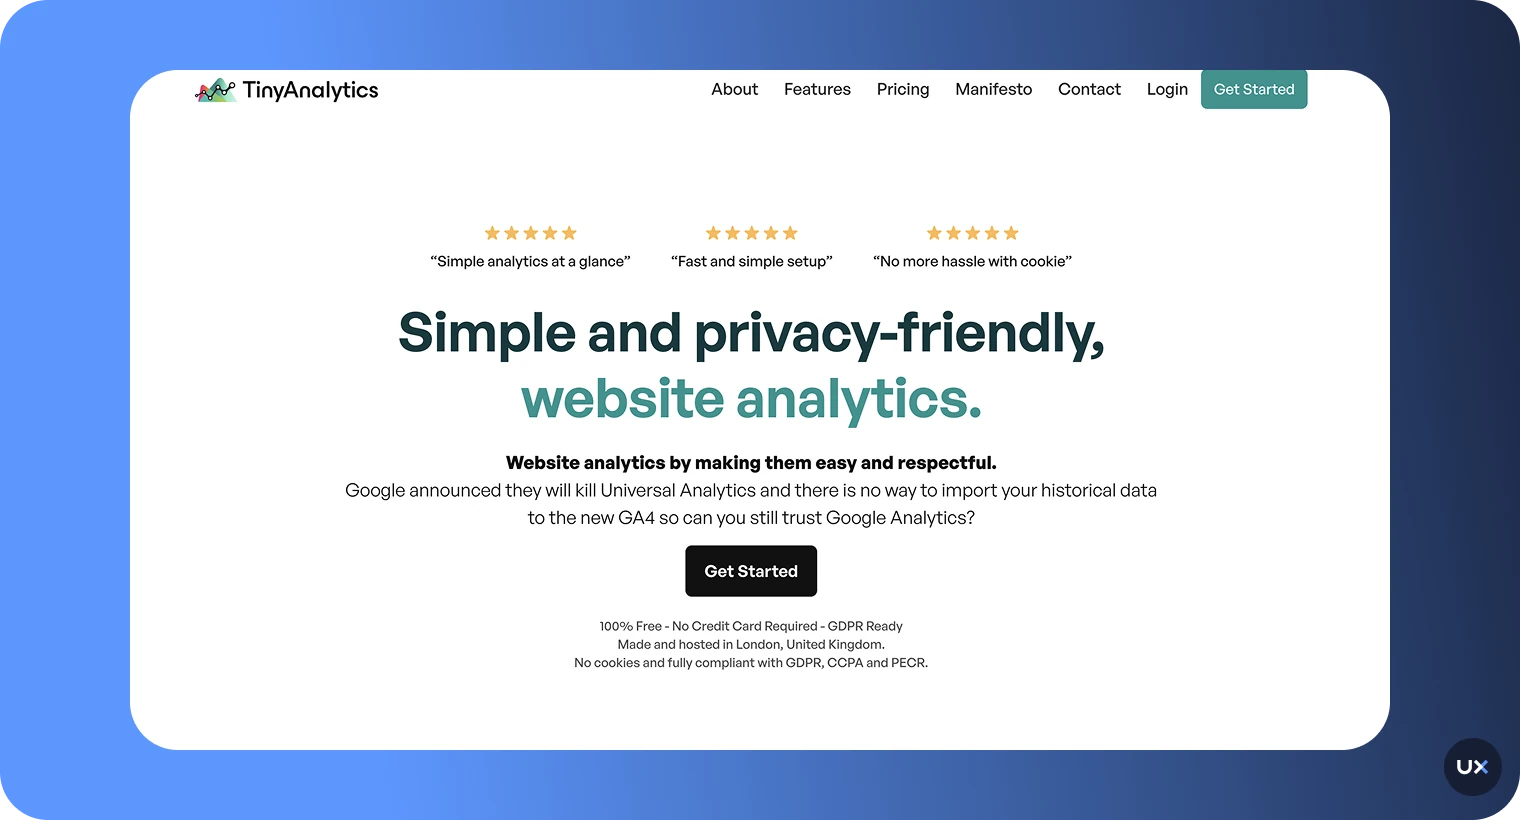
Tiny Analytics is known for its user-friendly interface and ease of use. It's a great choice if you're looking for a straightforward analytics tool without unnecessary complexity. The tool focuses on delivering actionable data with minimal setup. This means you don't have to wade through layers of configurations or unnecessary features to get to the critical information. It's ideal for small businesses or personal websites looking to understand visitor behavior without investing too much time or resources.
Key features
| Feature | Description |
|---|---|
| Lightweight Script | Uses a 6kb script that is 51 times smaller than Google Analytics, improving site load speed. |
| Privacy-Friendly | No cookies used, fully compliant with GDPR, CCPA, and PECR regulations. |
| Essential Metrics | Shows page-level data, geo-location, device, OS, browser, UTM parameters, and referrers. |
| Audience Behavior Analysis | Allows evaluation of visitor behavior and repeated actions. |
| Session Recording | Records user interactions, including clicks, scrolling, mouse movements, and keystrokes. |
Pros
Intuitive interface that’s easy for beginners to use.
Real-time reporting keeps you updated instantly.
Integrates smoothly with most platforms.
Flexible pricing plans for different budgets.
Cons
Lacks advanced features found in premium tools.
Limited customization for reports and dashboards.
May struggle with large datasets as your site grows.
Pricing
| Supported platforms | Pricing | Review Score (G2) |
|---|---|---|
| Web | Free plan; paid starting at ~£49/month | not on G2 |
11. SimilarWeb


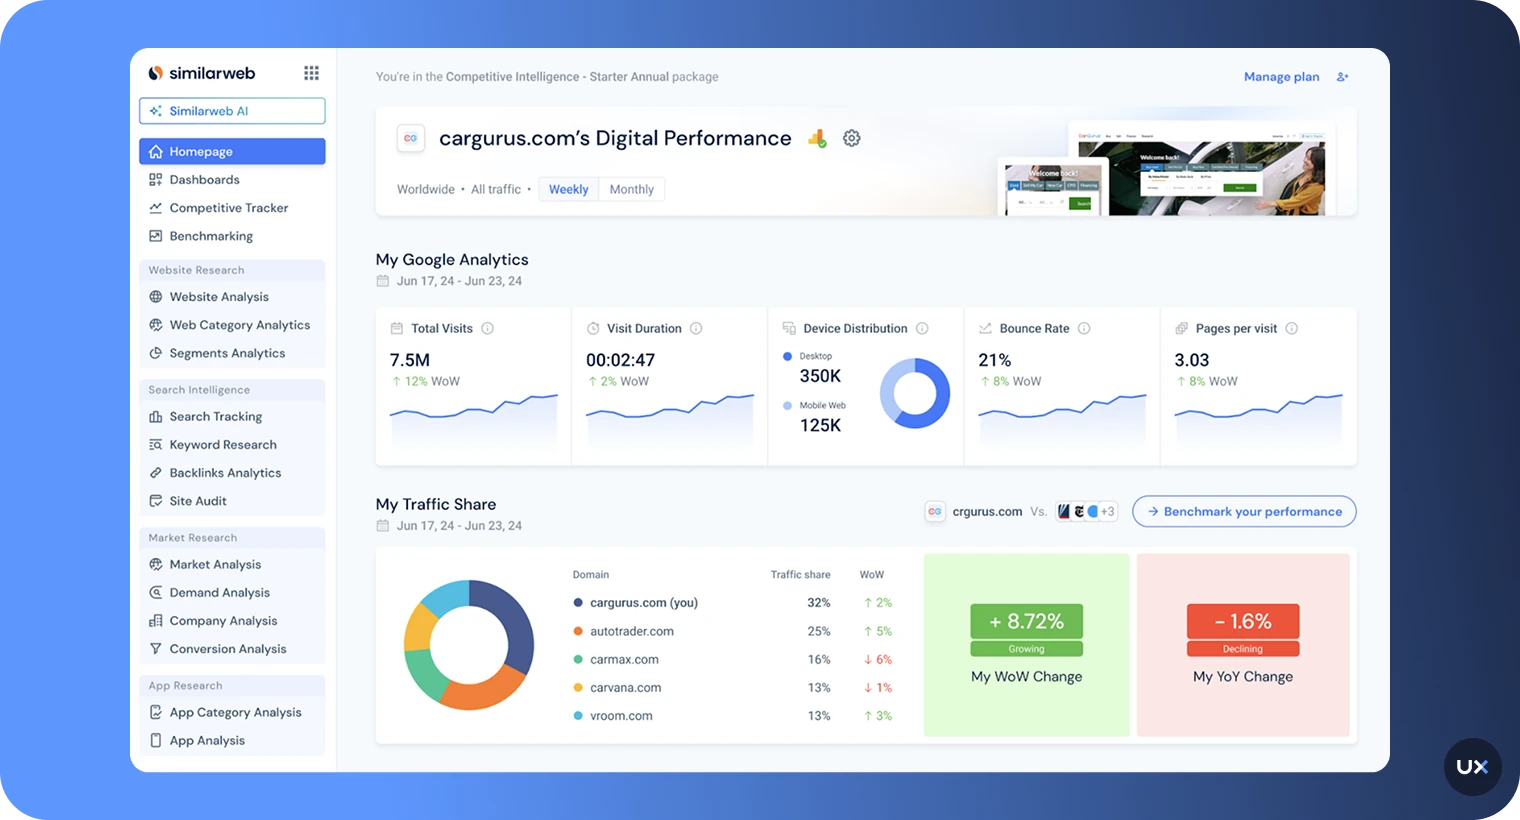
SimilarWeb provides competitive website analysis. It offers insights into your competitors’ performance, helping you stay ahead by refining your strategies. With SimilarWeb, you can dive into various metrics such as website traffic, engagement rates, and revenue estimations. One of the standout features is its user-friendly dashboard, which allows you to monitor competitor statistics, giving you a competitive edge in your market.
Key features
| Feature | Description |
|---|---|
| Competitor Statistics | Allows users to monitor and compare their website performance against competitors to gain insights and stay ahead in the market. |
| Target Audience Optimization | Helps in analyzing traffic and revenue metrics to better understand and optimize content for the target audience. |
| Traffic and Engagement Analytics | Track visits, bounce rates, and session durations across any domain. |
| Keyword and Referral Analysis | Discover which search terms and sources drive traffic to your site. |
| Channel Distribution | Break down traffic by direct, search, social, display ads, and referrals. |
Pros
User-friendly dashboard
Competitor statistics monitoring
Insightful reports on traffic and revenue
Great for identifying growth opportunities and benchmarking performance.
Cons
Limited data to desktop versions
Does not show sub-domains
Does not cover specific parts of websites
Pricing
| Supported platforms | Pricing | Review Score (G2) |
|---|---|---|
| Web, mobile | Free trial available; paid plan for entrepreneurs start from $125/month | 4.5/5 |
12. Woopra


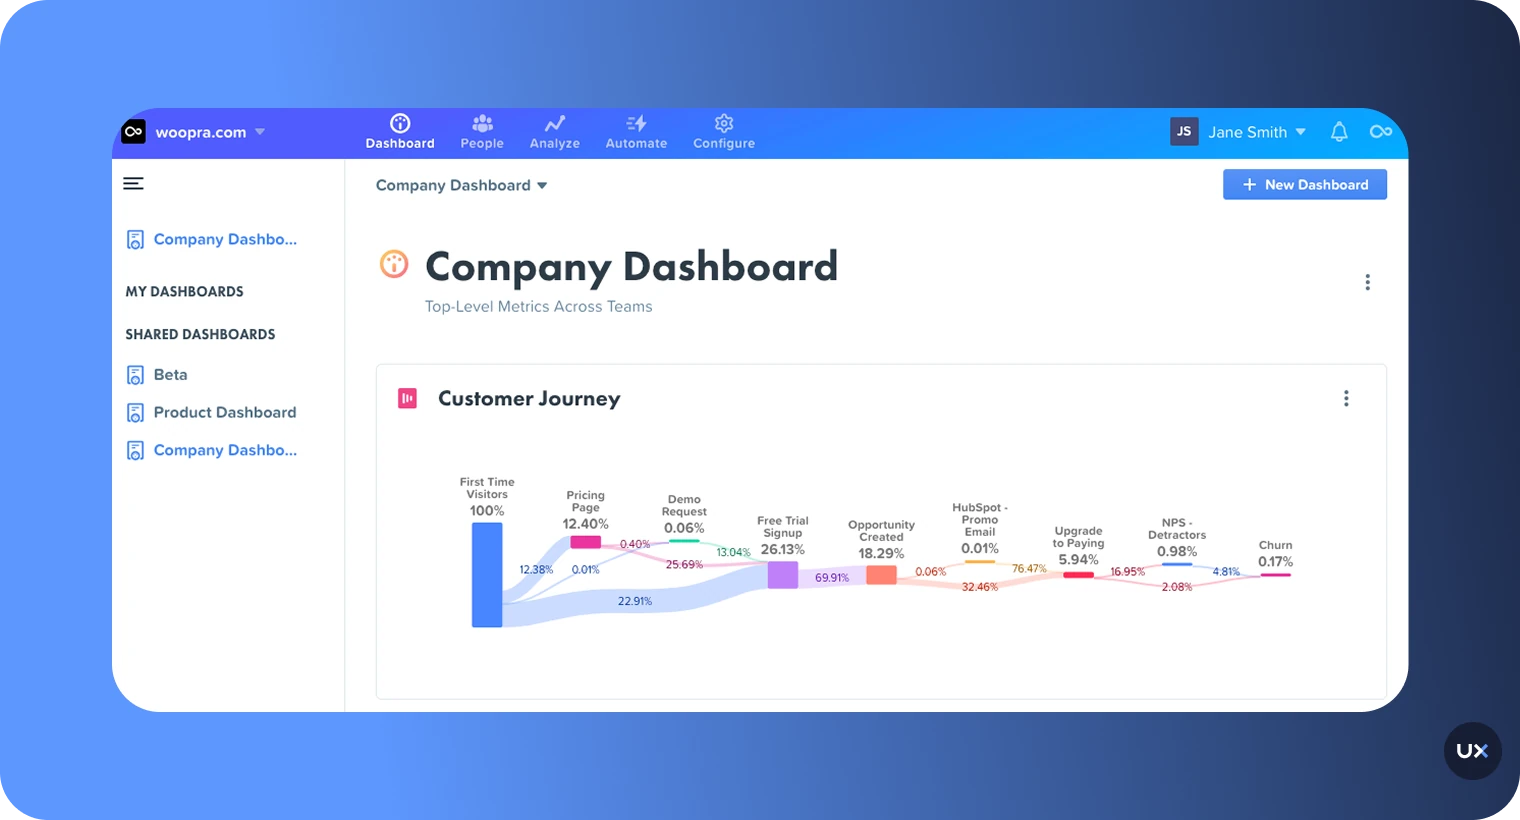
Woopra specializes in real-time customer journey analytics. It gives you a detailed view of the user journey across multiple touchpoints, enhancing website optimization. With its robust analytics suite, Woopra enables businesses to personalize interactions and drive engagement. Key features include detailed retention and trend reports, enabling you to understand user behavior over time and make data-driven decisions.
Key features
| Feature | Description |
|---|---|
| Visitor Journey Analysis | Analyzes visitors' journey on websites, campaign effectiveness, content views, and visitor behaviors. |
| Detailed Retention Reports | Provides detailed insights into user retention over time. |
| Trend Reports | Offers comprehensive trend analysis to understand user behavior patterns. |
| Real-Time Reporting | Gives real-time insights into website performance and visitor interactions. |
| Custom Triggers | Automate actions based on user behavior, such as sending messages or alerts. |
Pros
Detailed retention reports and trend reports
Real-time reporting
User-friendly interface
Tracks visitor journeys and campaign effectiveness
Cons
Long setup time
Complex for beginners
Expensive pricing
Pricing
| Supported platforms | Pricing | Review Score (G2) |
|---|---|---|
| Web, mobile | Free tier; Pro plan starts at ~$49/month for 50K+ actions | 4.5/5 |
13. Countly


Countly offers enterprise-grade analytics for mobile, web, and desktop applications. Its versatility makes it suitable for businesses seeking a unified analytics platform.Users appreciate Countly's data-driven decision-making capabilities and real-time analytics. The platform is designed for both developers and business users, making it accessible without needing extensive technical knowledge.
Key features
| Feature | Description |
|---|---|
| Data Sampling | Implements sampling methods for data processing, which may impact the precision of large datasets. |
| Advanced Features | Includes high-level capabilities and tools that are often available through premium packages. |
| Privacy and Security | Possesses robust measures to protect user data, though its status as a third-party service may cause concerns. |
| Customization | Offers an array of customization options for dashboards and reports to suit individual business needs. |
| Integration | Seamlessly integrates with various platforms and third-party services for a more comprehensive analytics approach. |
Pros
User-friendly interface makes it accessible even for beginners.
You can create and tailor reports to focus on the metrics that matter most to you.
Easily integrates with other platforms and tools to enhance functionality and data analysis.
Provides real-time insights for timely decision-making and strategic planning.
Cons
Despite its user-friendly interface, mastering all features can take time and require training.
Uses data sampling which can sometimes affect the accuracy of the reports.
Advanced features and capabilities may come with a high price tag.
Pricing
| Supported platforms | Pricing | Review Score (G2) |
|---|---|---|
| Web, mobile, desktop | Free Lite version; paid plan starts at $40/month | 4.1/5 |
14. Snowplow


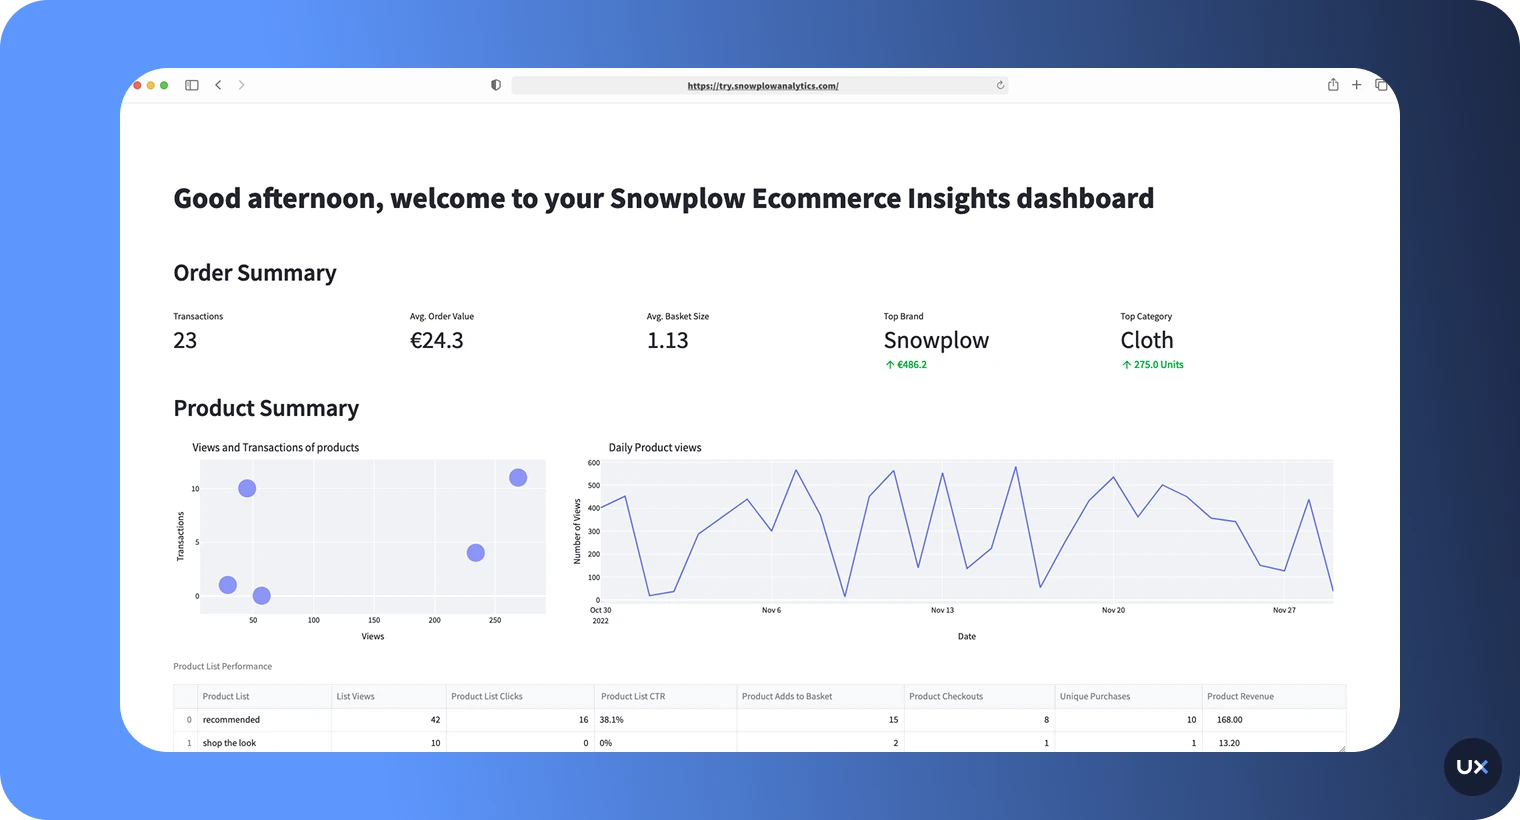
Snowplow is a customizable data collection platform that provides rich insights into user behavior. It allows for granular data tracking tailored to your business needs. It enables you to capture detailed behavioral data across multiple channels and platforms. The platform is designed to handle large-scale data collection and offers real-time reporting, making it an ideal choice for enterprises looking to scale.
Key features
| Feature | Description |
|---|---|
| Real-Time Reporting | Offers real-time data updates to help monitor the impact of changes as they happen. |
| Advanced Audience Segmentation | Allows for detailed segmentation of audience data to target specific user groups effectively. |
| Integration with Other Tools | Seamlessly integrates with a variety of third-party applications and services for enhanced functionality. |
| Data Visualization | Features advanced data visualization options to simplify the interpretation of complex data sets. |
| Event-Level Tracking | Capture detailed user interactions across websites, apps, and connected devices. |
Pros
Highly customizable data collection and management.
Open-source and community-driven, fostering continuous improvement.
Extensive support for real-time data processing and analytics.
Allows for the tracking of a wide range of user interactions.
Cons
Requires extensive setup and maintenance, which can be time-consuming.
May involve additional costs for infrastructure and cloud services.
Not as user-friendly for non-technical users.
Pricing
| Supported platforms | Pricing | Review Score (G2) |
|---|---|---|
| Web, apps | Custom pricing | 4.6/5 |
15. Piwik PRO


Piwik PRO Enterprise is a robust analytics solution known for its data privacy compliance. It offers both On-Premise and Cloud options, making it a versatile choice for businesses. Businesses have the flexibility to choose the best deployment option that suits their data governance policies. With Piwik PRO Enterprise, you get granular data control, which is essential for organizations needing to adhere strictly to privacy regulations like GDPR, CCPA, and others.
Key features
| Feature | Description |
|---|---|
| Privacy-Compliant Analytics | Offers analytics that comply with GDPR, CCPA, and HIPAA regulations. |
| Built-in Consent Management | Includes a consent manager for collecting personal and anonymous data in a compliant way. |
| Tag Manager | Provides an integrated tag management system. |
| EU/DE Cloud Hosting | Offers secure hosting options in the EU (Germany for DE version). |
| Custom Reports & Dashboards | Allows creation of custom reports and real-time dashboards. |
Pros
Highly customizable dashboards
Seamless integration with marketing and CRM platforms
Support for on-premises hosting
Advanced user and event tracking capabilities
Cons
More complex setup and maintenance compared to other tools
May require technical expertise for customization
Higher cost for enterprise features and on-premises hosting
Pricing
| Supported platforms | Pricing | Review Score (G2) |
|---|---|---|
| Web, apps | Business plan from ~€35/month | 4.6/5 |
Key features to look for in web analytics tools
When evaluating web analysis tools, it's essential to consider the specific features that will add value to your business. Here are some pivotal aspects:
Visitor reports: Understanding who visits your site is crucial. Look for tools that offer comprehensive visitor reports, detailing metrics such as demographics, location, and device usage. These insights can help you tailor your content and marketing strategies.
Behavior analysis: Behavior analysis provides an in-depth view of how users interact with your site. Focus on tools that offer detailed behavior reports, including page views, time spent on site, and navigation paths. Heatmaps and session recordings are also valuable for visualizing user engagement.
Technical information: Technical analytics can help you grasp the performance of your site from a technical standpoint. This includes metrics on load times, browser types, and device performance.
Marketing campaigns: Your web analytics tool should track the effectiveness of your marketing efforts. This includes website visitor tracking, referrals, and conversions. Integration with other marketing platforms can be a bonus, offering a more holistic view of your efforts.
SEO insights: SEO remains a cornerstone for driving organic traffic. Opt for tools that provide SEO analytics, building insights into keywords, rankings, and organic traffic. This data is vital for enhancing your search visibility over time.
Data privacy and security: Data security is paramount, especially with growing regulations like GDPR. Ensure the tool you choose complies with relevant data protection laws. Features like data anonymization and secure data storage are critical.
User-friendly reporting: Complex data is only useful if it’s understandable. Look for tools that offer customizable reporting.
How to choose your web analytics tool
Choosing the right web analytics tool can be a game-changer for your digital strategy. Here are some factors to consider:
Scalability: Your needs will grow as your business grows. Select a tool that can easily scale with increasing traffic and data volume. Look for flexible pricing plans that can adapt to the lifecycle of your business.
Integration capabilities: Ensure the tool can integrate with your existing tech stack, CRM systems, marketing automation platforms, and other essential business tools. Seamless integration will help you create a unified data ecosystem.
Customization options: Every business has unique requirements. Choose a tool that offers customization in terms of dashboards, reports, and data segments. Customizable tools allow you to focus on the metrics that matter most to your organization.
Ease of use: A user-friendly interface is crucial. The tool should be intuitive enough for team members to use without extensive training. This will save time and reduce the learning curve, enabling immediate insights.
Support and resources: Responsive customer support and a rich library of resources, including tutorials and forums, can make a significant difference. Evaluate the support options available, such as 24/7 live chat or a dedicated account manager.
Cost-benefit analysis: Budget is a key consideration. Compare the costs of different tools along with the benefits they offer. Sometimes, a more expensive tool can deliver greater ROI through advanced features and capabilities.
Future trends in web analytics
Web analytics is entering a new phase shaped by AI advancements, edge computing, and shifts in user expectations. Below are the trends that will define the next generation of analytics tools.
Cookieless and identity-free analytics
As third-party cookies disappear and privacy laws tighten, analytics is moving toward identity-free tracking. Instead of relying on cookies or personal identifiers, future tools will increasingly use first-party data, server-side tracking, and aggregated behavioral modeling. This shift will allow teams to continue measuring performance without storing sensitive information or breaching compliance requirements.
On-device (edge) analytics
To improve privacy and reduce latency, analytics will gradually shift from cloud processing to on-device computation. In this model, raw interaction data is analyzed directly on the user’s device, and only anonymized insights are sent to the server. This approach minimizes data exposure, accelerates real-time insights, and aligns with growing expectations for privacy-by-design solutions.
Zero-party analytics and user-shared intent
Users are becoming more willing to share preferences, intent, and experience data when it is transparent and beneficial. Future analytics will blend zero-party data (what users intentionally share) with behavioral insights to power more accurate personalization without intrusive tracking. This trend helps teams gather richer, consent-driven information that respects user autonomy.
Predictive UX analytics (experience forecasting)
Analytics tools will evolve from describing past behavior to predicting future outcomes. With advancements in machine learning, platforms will forecast which journeys are likely to cause friction, which users are at risk of churn, and which UI elements will trigger frustration. This kind of predictive UX will allow teams to fix issues before they affect users.
Autonomous, insights-first analytics
Instead of relying on teams to search dashboards for answers, analytics platforms will increasingly surface insights automatically. Expect tools to generate weekly summaries, notify you of unusual patterns, recommend fixes, and answer natural-language questions instantly. This future of autonomous analytics reduces manual analysis and ensures that insights reach stakeholders faster.
Synthetic user analytics and AI simulations
Analytics platforms will soon be able to simulate user behavior before real users even interact with a site. AI-driven simulated journeys will run through new flows, predict conversion friction, and stress-test features at scale. This will help teams identify usability issues earlier in the development cycle and reduce reliance on actual traffic to uncover problems.
Turn your website data into smarter decisions
Choosing the right web analytics tool is the key to understanding what truly drives your website’s performance. The right platform helps you see how users interact, where they struggle, and what leads them to convert, turning raw data into actionable insights that grow your business.
When comparing tools, focus on what matters most: intuitive setup, customizable dashboards, strong privacy controls, and the ability to track both quantitative and qualitative data. Whether you’re optimizing conversions or improving usability, your analytics platform should simplify how you work.
If you’re ready to go beyond surface-level metrics, UXCam gives you the full picture. With session replays, heatmaps, and funnel analytics in one platform, you can understand both the what and why behind user behavior, without heavy setup or guesswork.
Start your free trial with UXCam today and see your product through your users’ eyes.
Web Analytics Tools - FAQ
What is a web analytics tool?
A web analytics tool is software that helps you measure, collect, analyze, and report data from your website. It helps you understand your audience, improve your website or app, and enhance user experience and engagement. By adding a tracking code to your site, these tools provide insights on who's visiting, how long they stay, where they come from, and what they do during their visit.
With this information, web analytics tools can show you data like page views, session durations, bounce rates, and click paths. You can use this to improve marketing strategies, site functionality, and make better business decisions. Different tools have different features; some offer real-time data, others focus on security and privacy, or provide advanced user segmentation.
What is the most popular web analytics tool?
Google Analytics is a top choice when it comes to web analytics tools. It's loaded with features and holds a big part of the market. This tool gives you insights into how visitors behave on your site, who they are, and how they convert. This is crucial for businesses that want to really understand their audience.
Consider using UXCam as an alternative to Google Analytics. Known for its in-depth focus on user experience, UXCam offers more than just basic metrics. It provides a detailed look at user interactions and behaviors on your site. With UXCam, you can gain useful insights into user experiences, helping you improve your website.
What’s the difference between web analytics and product analytics?
Web analytics measures traffic, engagement or both, while product analytics focuses on in-app or product behavior. UXCam unifies web analytics and product analytics, giving teams a complete view of user journeys across web and mobile.
Are free web analytics tools enough?
Free tools cover basics like traffic, but lack deep behavioral insights. UXCam offers a free plan with advanced features, heatmaps, funnels, and replays, to help you understand real user behavior.
Why should I use UXCam for web analytics?
UXCam combines quantitative data with visual context to show exactly how users experience your site. It’s easy to install, privacy-compliant, and built for teams that want actionable insights fast.


Related articles


Product Management
13 Best Product Management Tools 2026 & When to Use Them
Find out the top tools that the best product managers use daily to perform better at...


Jane Leung
Product Analytics Expert


Curated List
As 14 Melhores Ferramentas de Análise Web em 2026
Descubra as melhores ferramentas de análise web. Quer melhorar a experiência do usuário no seu site? Saiba quais são os recursos indispensáveis para uma análise web...

Jonas Kurzweg
Product Analytics Expert


Curated List
12 Best Customer Analytics Tools and Platforms 2026
In this article, we've compiled a list of customer analytics tools trusted by thousands of businesses worldwide and insights to help you select one that best suits your...


Tope Longe
Product Analytics Expert